- Download 3D mesh data as a obj file
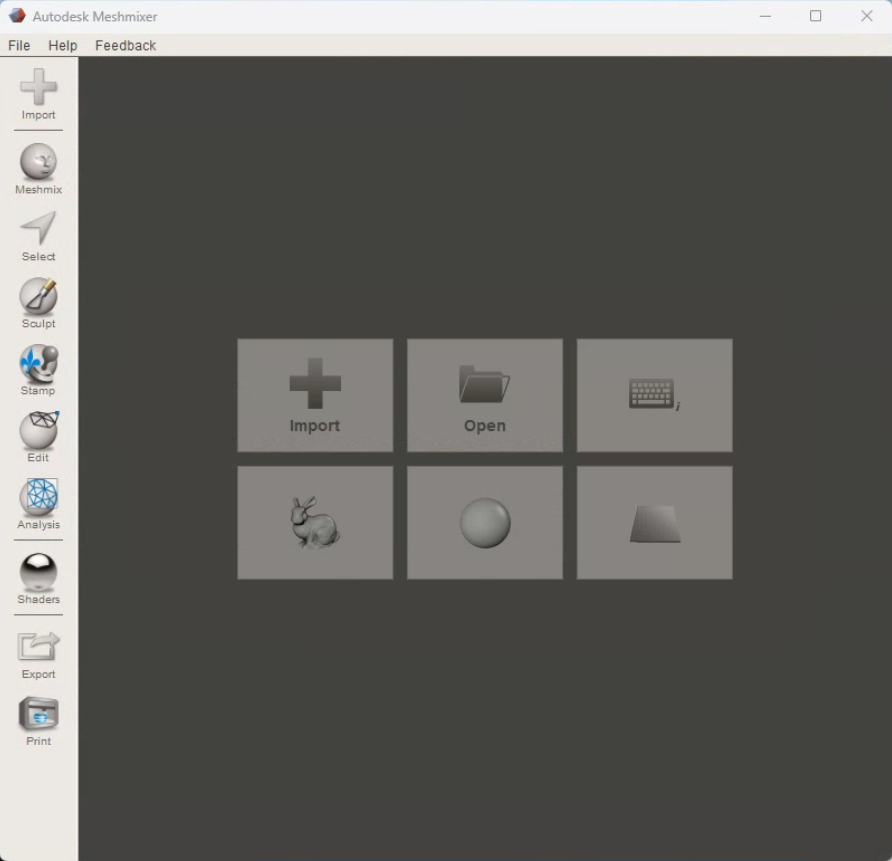
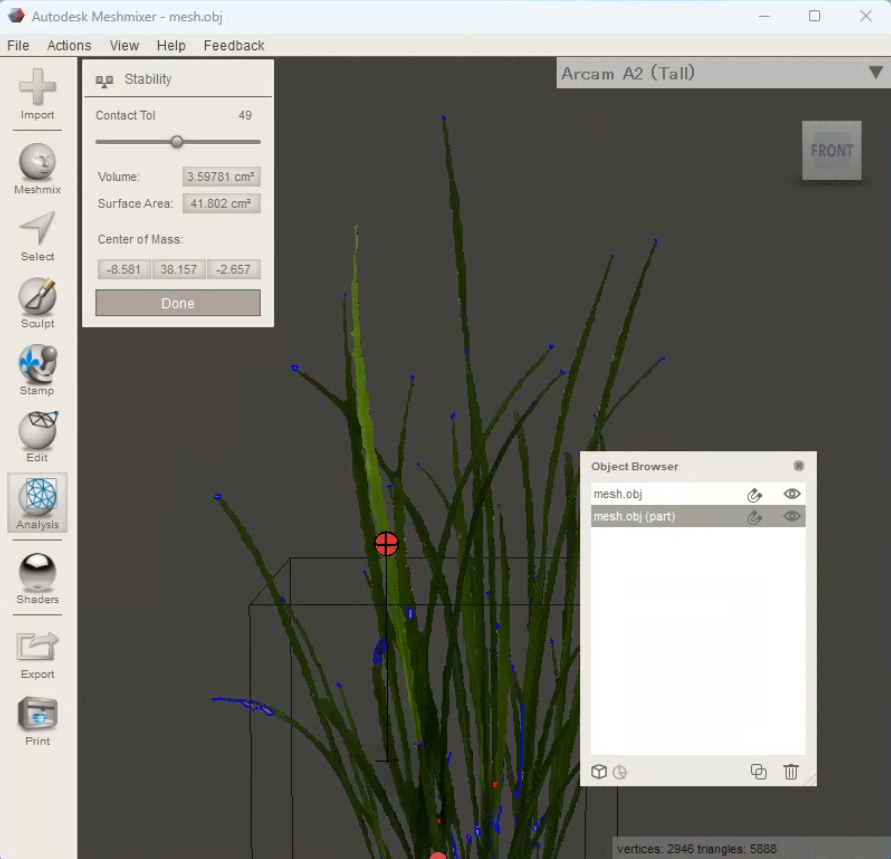
- Process 3D mesh data using meshmixer
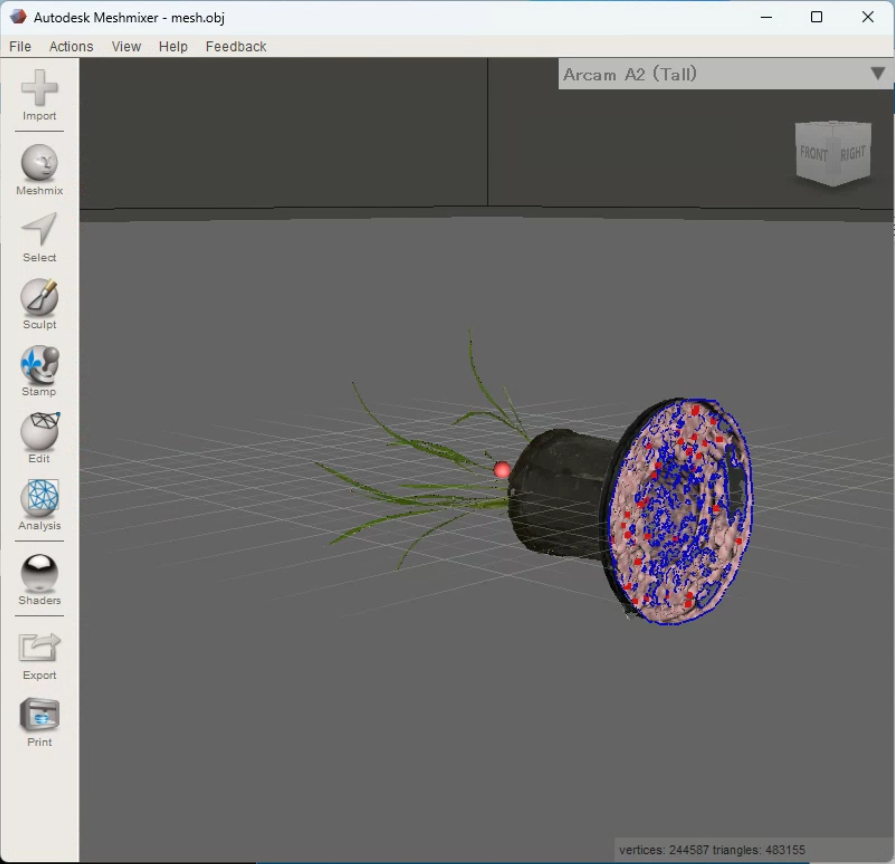
- Import -> select obj file to open
- move mouse with right click to rotate the view
- move mouse with pushing center roller to move the view
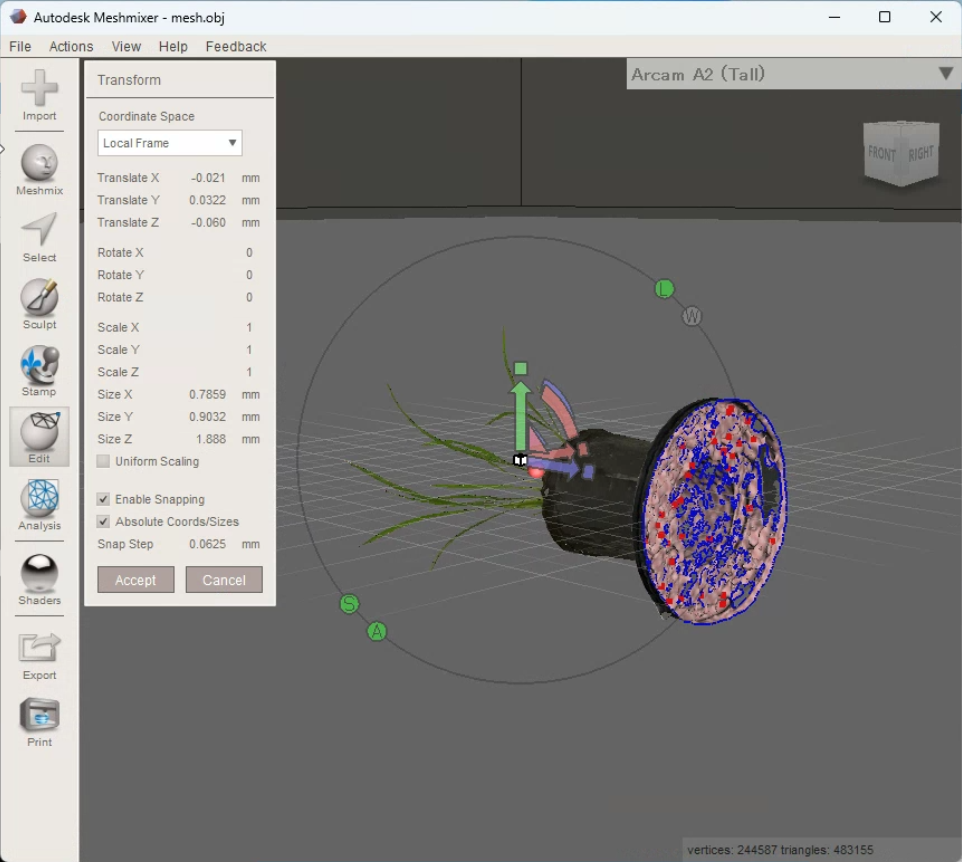
- Edit -> Transform
- Analysis -> Units/Dimensions
- convert units if needed

- right click and drug to set the line to set scale
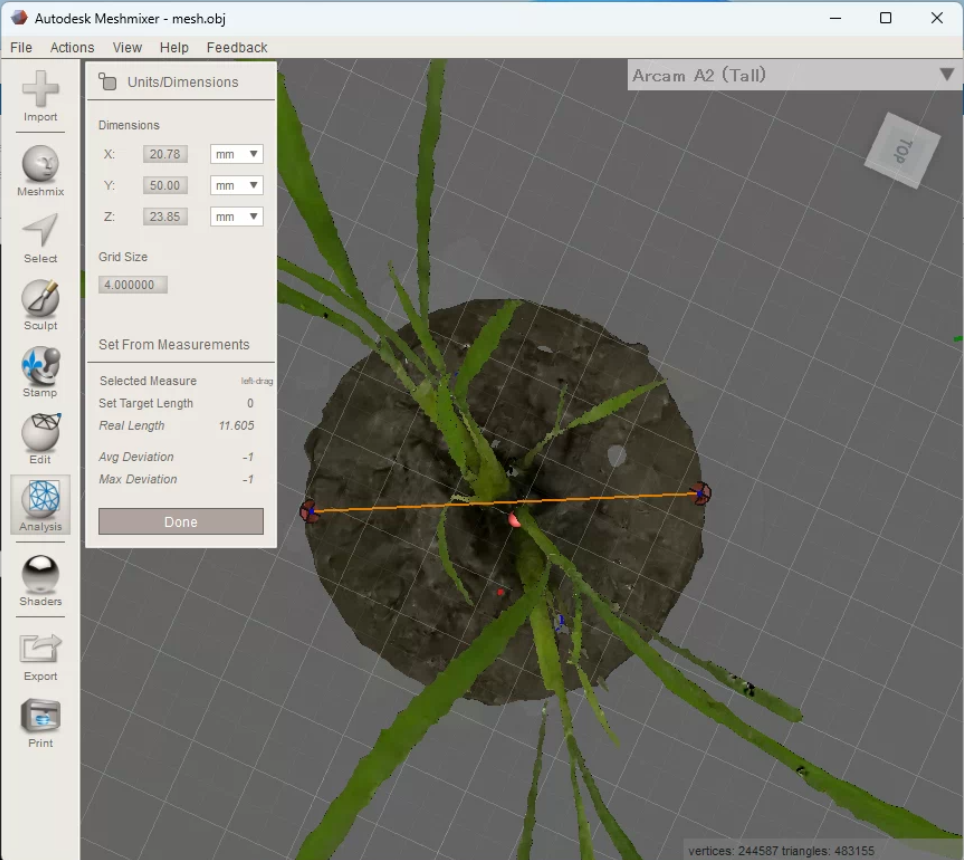
- input the actual length of the set line to "Set Target Length"
- Edit -> Plane Cut
- Rotate and move the region to extract plant body
- Cut type: Cut (Discard Half)
- Fill Type: Remeshed Fill
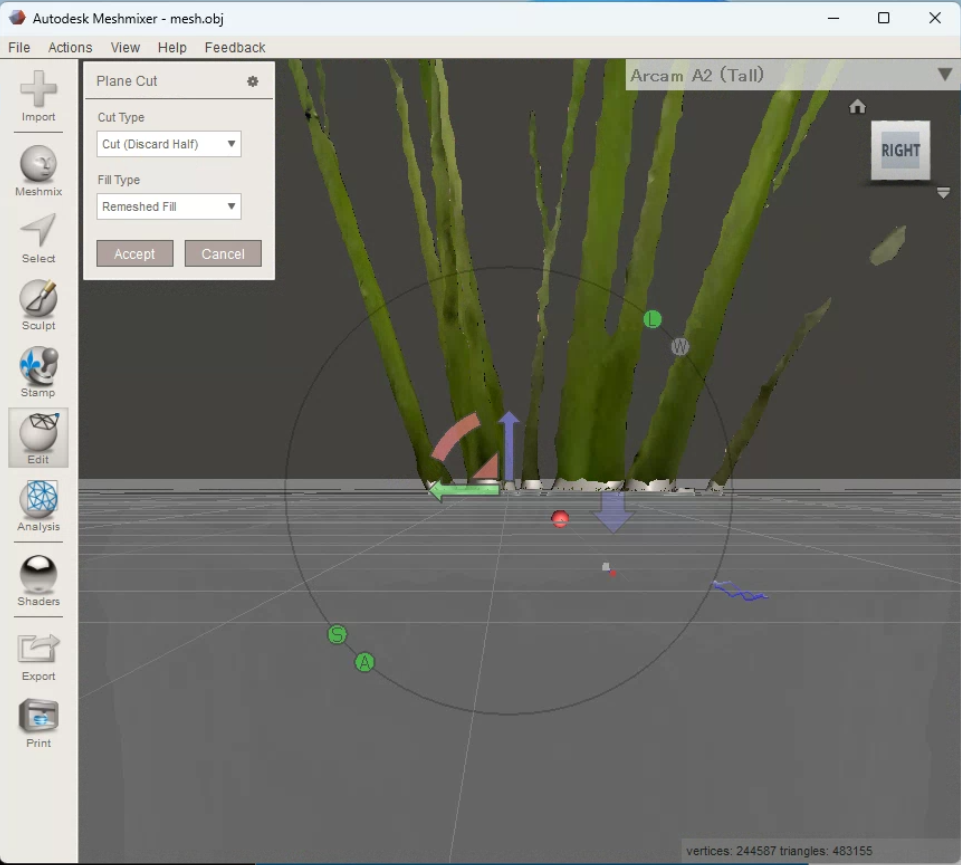
- Accept to cut the region
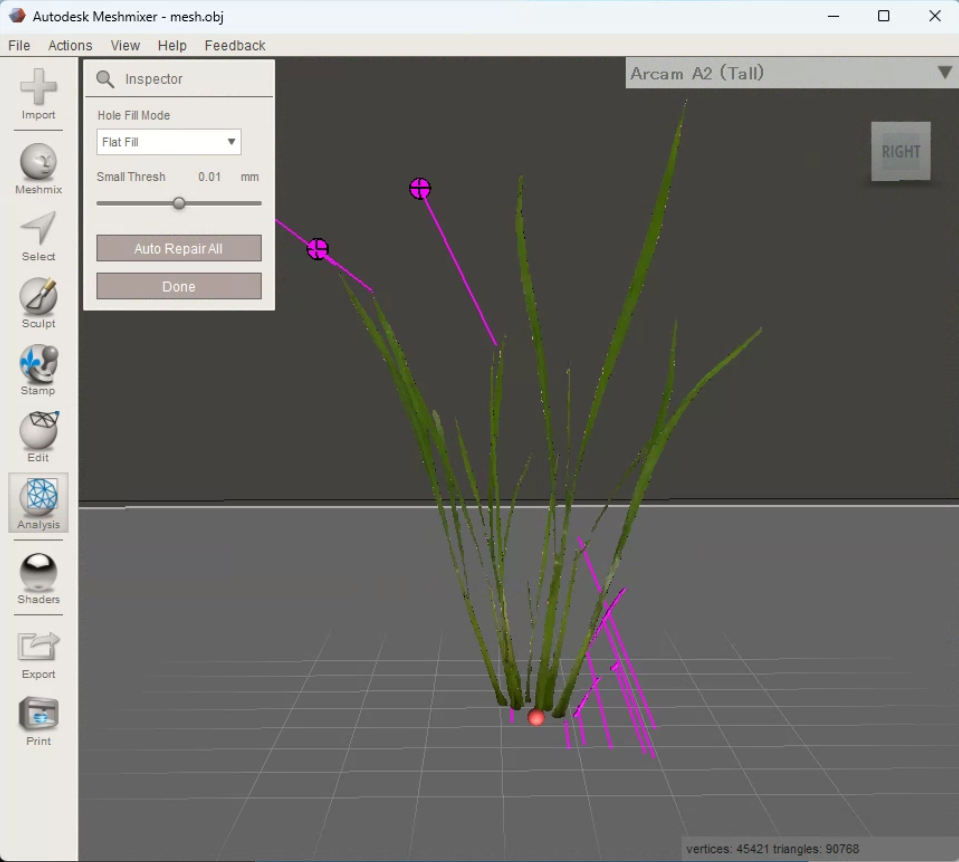
- Analysis -> Inspector
- repair the 3D model by filling hole
- Hole Fill Mode: Smooth Fill
- Small Thresh: set the optimal size to remove some noises
- Select
- Brush Mode: Unwrap Brush
- Size: set the size of the brush to select region
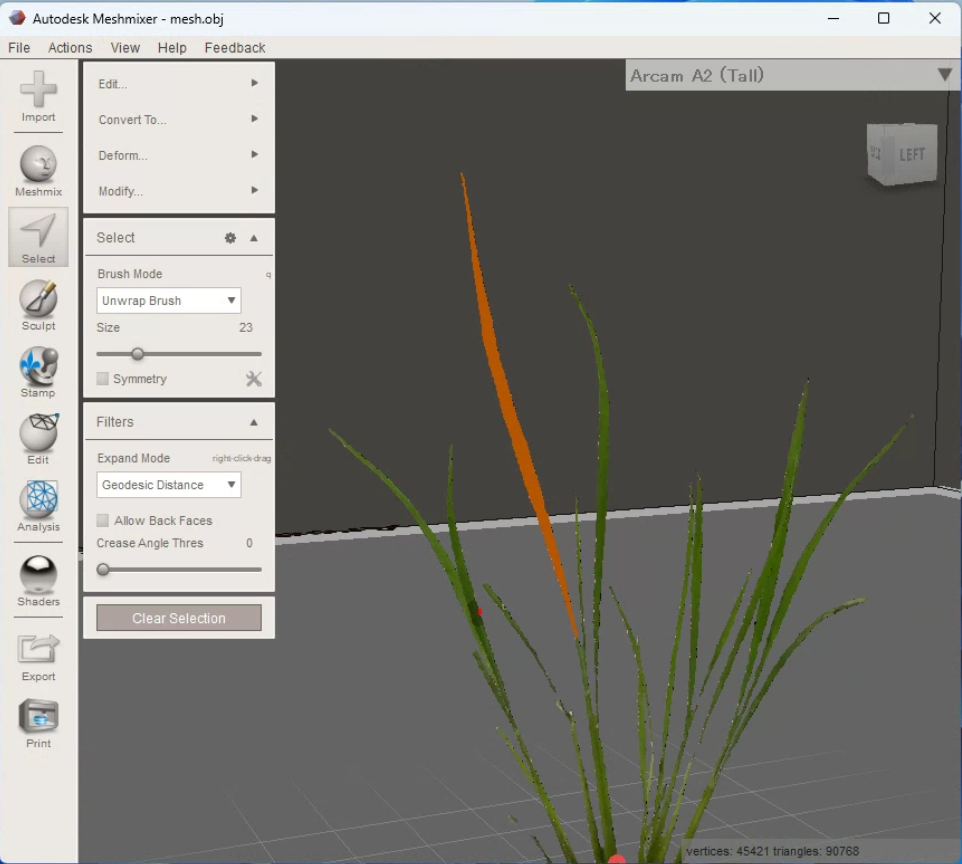
- Edit -> separate to separate the selected region
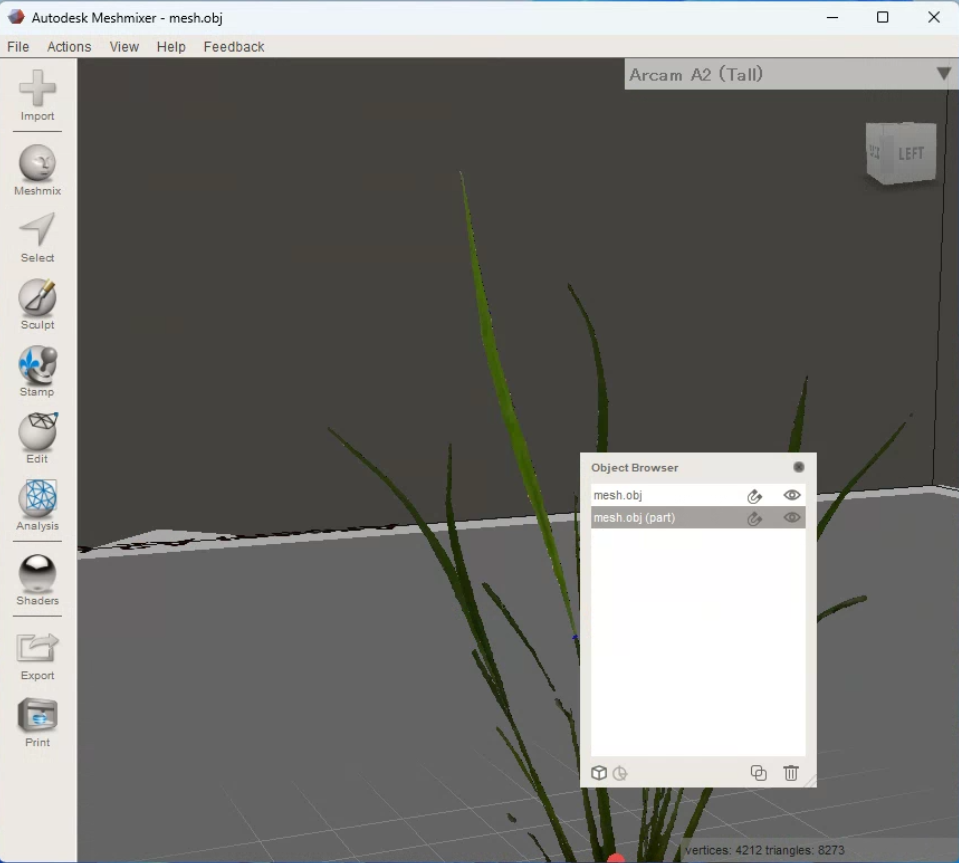
- Please conduct repair again from Inspector in need
- Object Browser can be opened from View -> Show Objects Browser
- Analysis -> Stability

Calculate the area of green leaves using the vegetation index and the area of red leaves using the a-axis of the Lab color space using ImageJ (植生指数を用いて緑葉、Lab色空間のa軸を用いて赤葉の面積を算出する)
The vegetation index is an indicator used to quantify the vigor of vegetation and has been used for monitoring vegetation using remote sensing. This index can be used to extract green leaves from an image. For example, there is a vegetation index called Excess Green (ExG), which is the sum of the difference between green and blue and green and red. Because chlorophyll does not reflect green light as well as blue and red light, ExG values are higher in areas of healthy green leaves. In this article, this ExG is used to set the threshold value to extract the green leaf area.
On the other hand, plant leaves may contain red regions in addition to green. For example, quinoa may accumulate a red pigment called betalain in its leaves. We may want to measure this area as well. In this article, we will use the a axis of the Lab color space to extract the red area.
植生指数は、植生の活性を定量化するための指標であり、リモートセンシングを用いた植生のモニタリングなどに用いられてきました。この指数を、画像から緑葉を抽出するのに使うことができます。例えば、緑と青の差と緑と赤の差を足し合わせたExcess Green(ExG)という植生指数があります。クロロフィルは、青色光と赤色光に比べて緑色光は反射しないという性質を持つため、健康な緑葉の領域ではExGの値が大きくなります。今回は、このExGを用いて閾値を設定することで、緑葉の領域を抽出します。
一方で、植物の葉には、緑の他に赤の領域が含まれることがあります。例えば、キノアは葉にベタレインという赤色の色素を蓄積することがあります。この面積も測りたくなったりします。今回、赤色の領域の抽出には、Lab色空間のa軸を用いてみます。
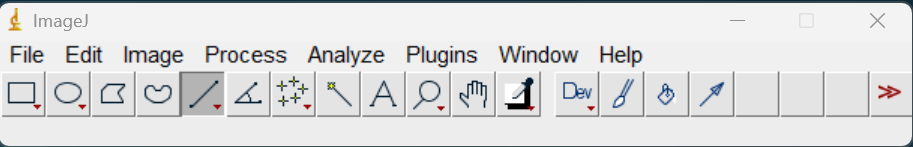
Green leaf area measurement
Setting of scale
- File -> Open
- Make line to set scale
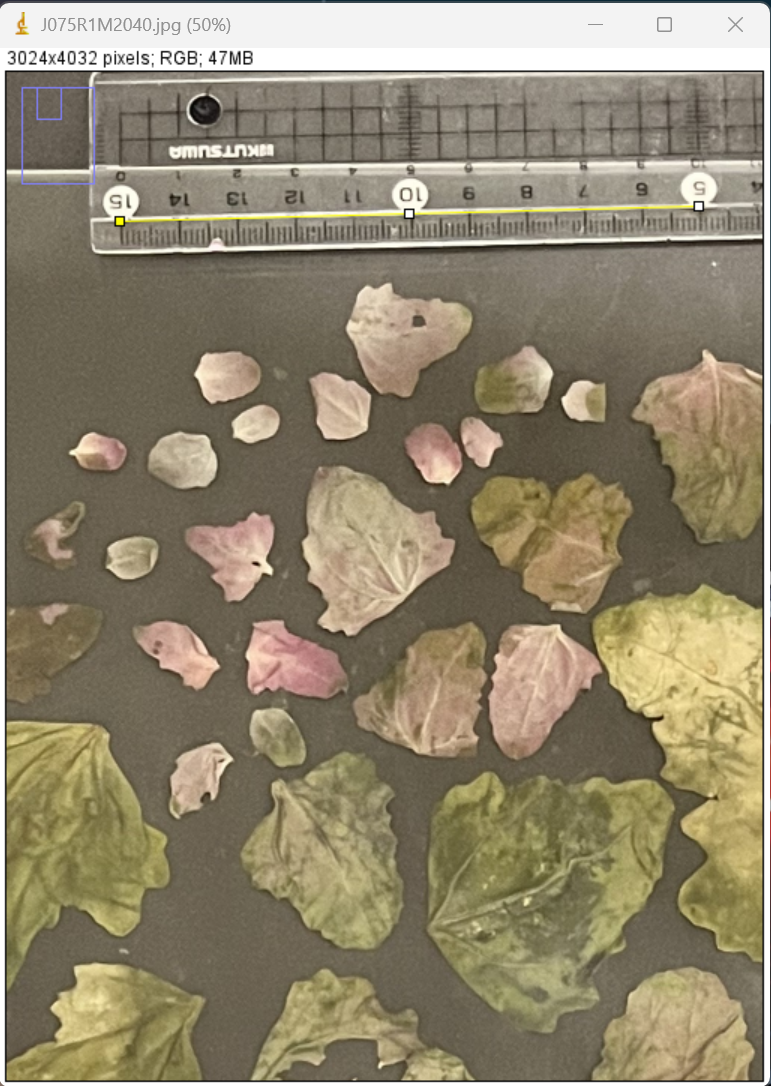
- Analyze -> Set scale
- Known distance: 10
- Unit of length: cm
Creating ExG Images
- right click on the original image and duplicate
- Image -> Type -> RGB stack
- Image -> Stacks -> Stack to Images Red, Green, and Blue channel image is opened
- Get Green - Red image
Process -> Image calculator
Image1: Green
Operation: Subtract
Image2: Red
check "Create new window" check box
"Result of Green" is opened
right click and rename the image "G-R" - Get Green - Blue image
Process -> Image calculator
Image1: Green
Operation: Subtract
Image2: Blue
check "Create new window" check box
"Result of Green" is opened
right click and rename the image "G-B" - Get ExG (Green-Red)+(Green-Blue) image
Process -> Image calculator
Image1: G-R
Operation: Add
Image2: G-B
check "Create new window" check box
"Result of G-R" is opened
right click and rename the image "ExG"
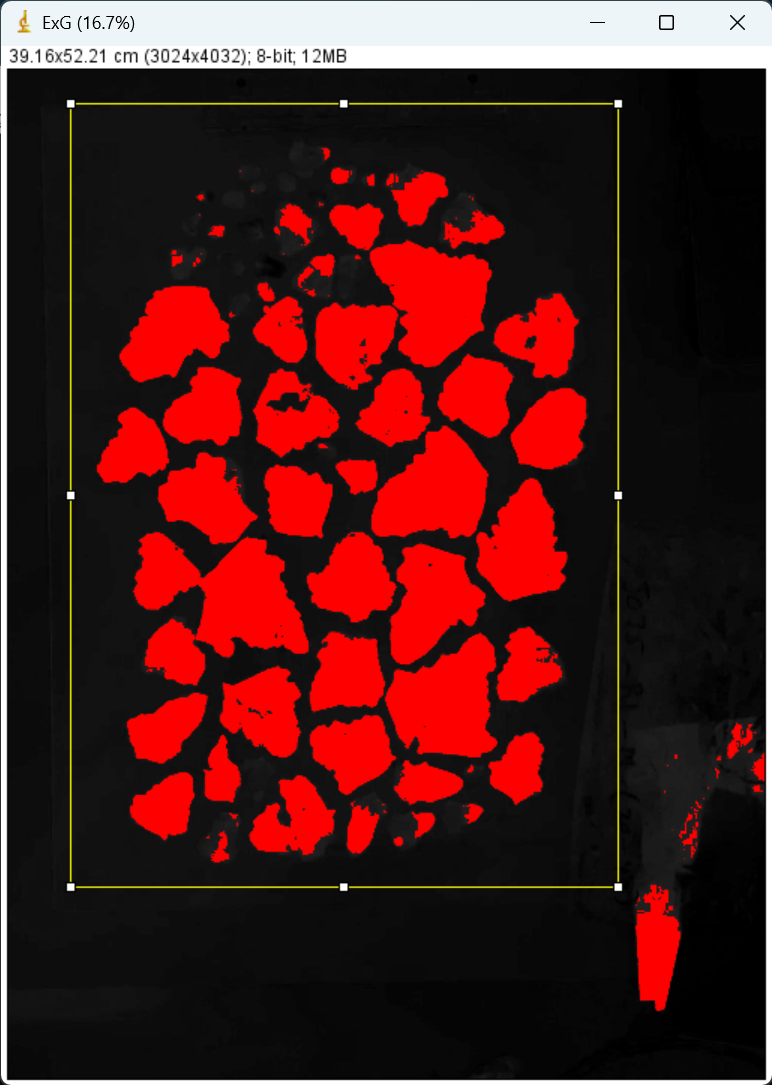
Extracting green leaf region and area measurement
- Image -> Adjust -> Threshold
Otsu
Red
check "Dark background" check box
- Select the region for calculation
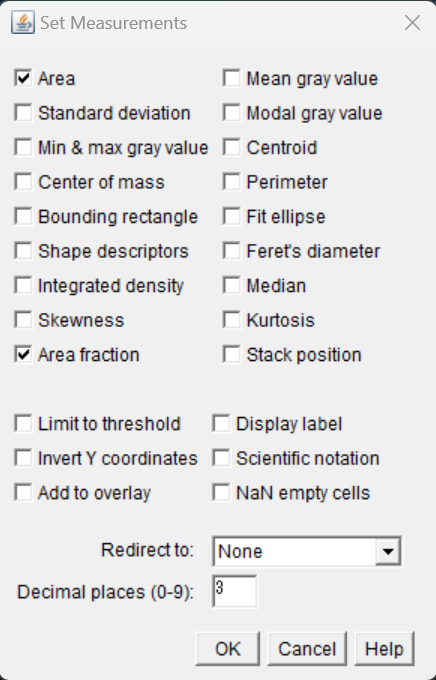
- Analyze -> Set measurements
check "Area" and "Area fraction" check box
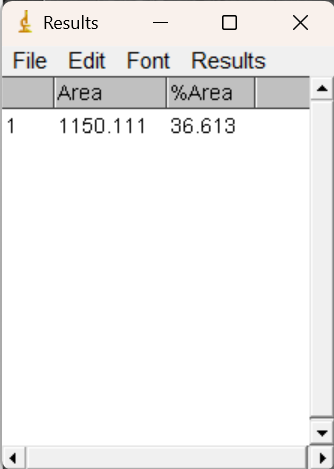
- Analyze -> measure
- "Results" window is opened
Area of the selected region and the area fraction of the thresholded region are output
by multiplying these values, area of the thresholded region is calculated
Red leaf area measurement
- right click on the original image and duplicate
- Image -> Type -> Lab stack
- Image -> Stacks -> Stack to Images
L, a, and b channel image is opened
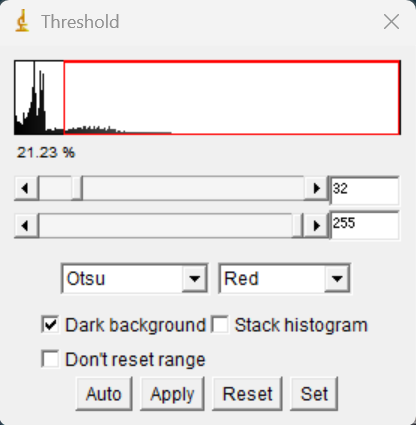
a channel is used - Image -> Adjust -> Threshold
the threshold can be set manually by moving these bars
 Red
Red
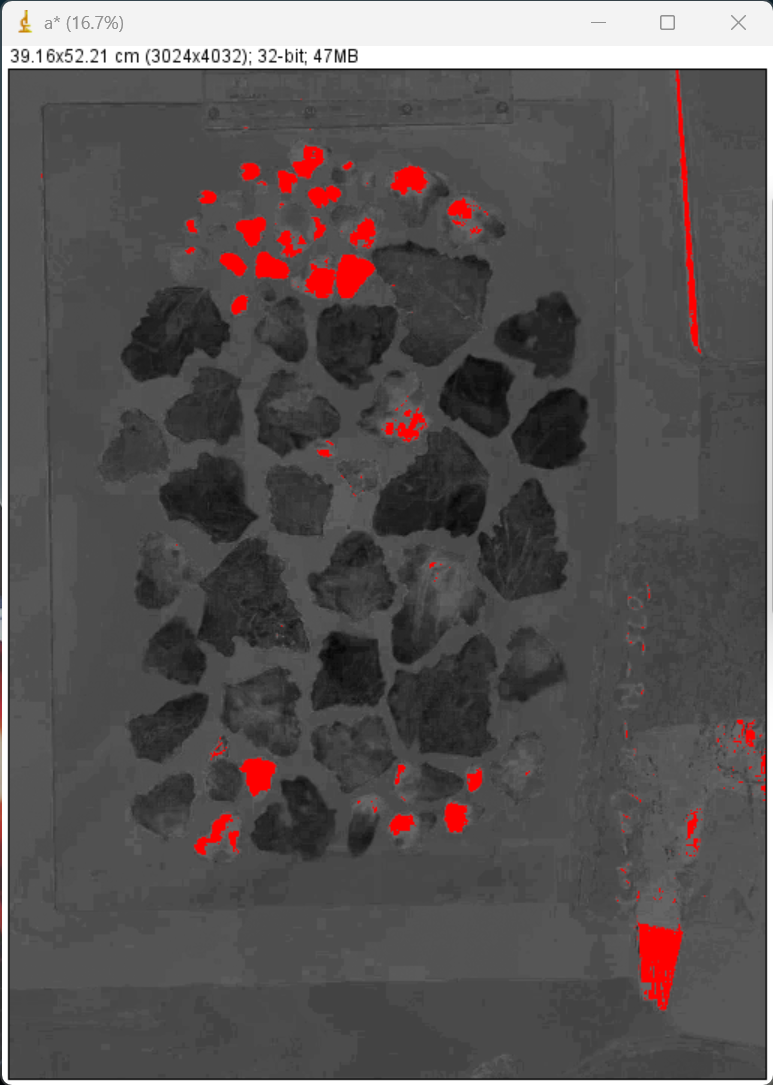
click "Set" button to fix the threshold - Analyze -> measure the results added in "Results" window as well
Each organ measurement and digital number extraction using ImageJ (ImageJを用いて各器官ごとに測定と画素値の収集を行う)
Here, how to output area, length, and width information, as well as the average pixel value for each organ from images using ImageJ is introduced. For example, leaf area is needed to calculate the Leaf Area Index (LAI), the area of leaves per unit land area, which is an important parameter for crop dry matter production. Image pixel values can be used to compare leaf colors relatively.
ここでは、ImageJを用いて画像から各器官の面積、長さ、幅の情報と、平均画素値を出力する方法を紹介します。例えば、葉の面積は作物の乾物生産に重要なパラメータである単位土地面積当たりの葉の面積(Leaf Area Index: LAI)の算出に用いたり、画像の画素値は葉の色を相対的に比較するのに用いたりすることができます。
- Calculation of area, length, and width and preparation for pixel value measurement
面積、長さ、幅の計算と画素値測定の準備- File -> Open
you can open an image file to process
処理する画像ファイルを開く。 - Crop image
画像の切り出し - Set scale
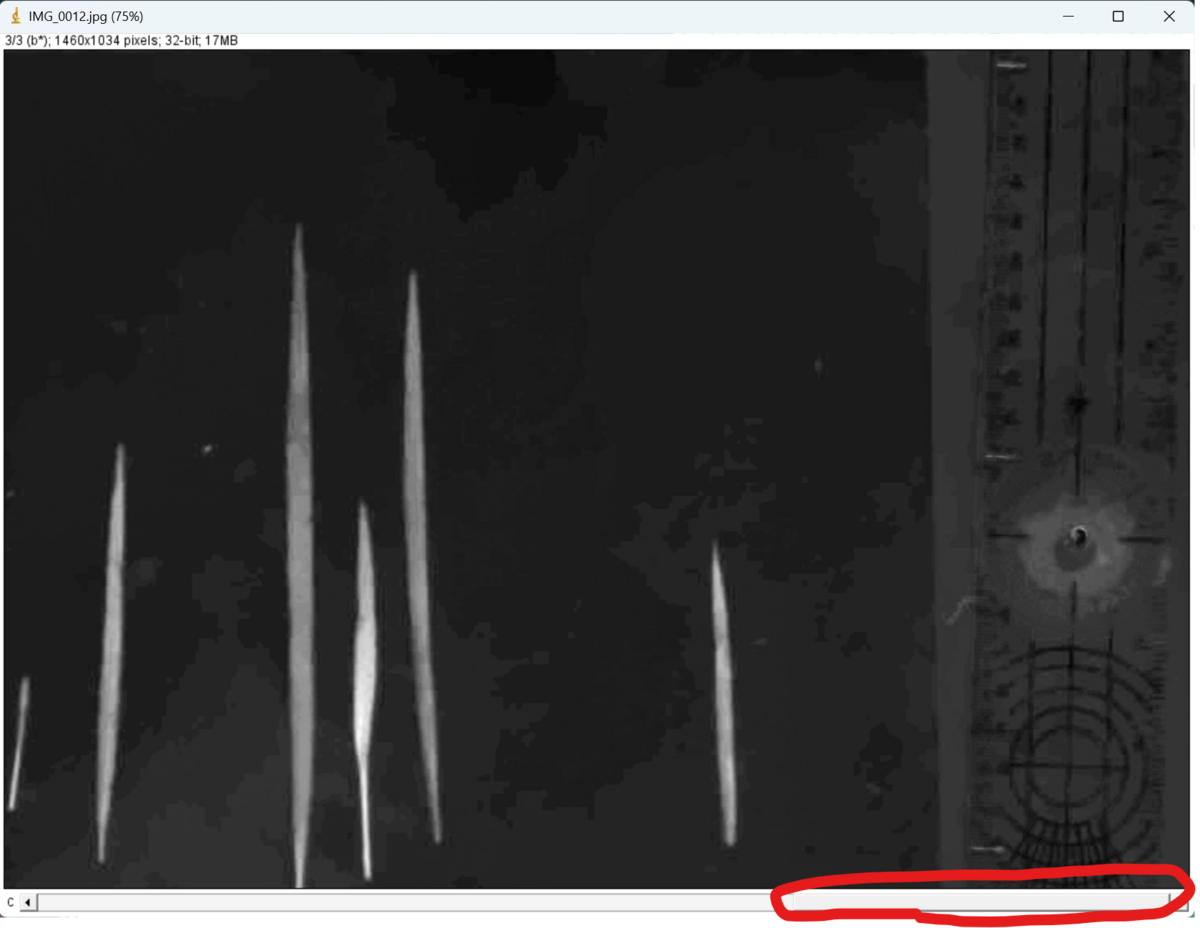
スケールの設定- put a straight line along with the scale
スケールに沿って直線を設置

- Analyze -> Set Scale
- Known distance: Actual length of the set straight line
設置した直線の実際の長さ - Unit of length: Unit of length of actual length ex) cm, m
設置した直線の実際の長さの単位(例:cm, m)
- Known distance: Actual length of the set straight line
- put a straight line along with the scale
- Extract region to process
処理する器官の領域を抽出する- Image -> Type -> Lab Stack
Conduct Lab stack
Lab色空間に変換する - move to a channel
処理を行うチャンネルに移動- leaf -> "a" channel

- stem-> "b" channel
- leaf -> "a" channel
- Image -> Adjust -> Threshold
- Please find a method to extract regions precisely
正確に各器官の領域を抽出できるアルゴリズムを選択
Selection area can be inverted by put check in Dark background check box
"Dark background"にチェックを入れることで、選択領域を反転させることができる(If you want to set the threshold manually, move the bar below to set the threshold, then click "Set")
(もしマニュアルで閾値を設定したい場合は、以下のバーを動かして閾値を設定した後に、"Set"をクリックする)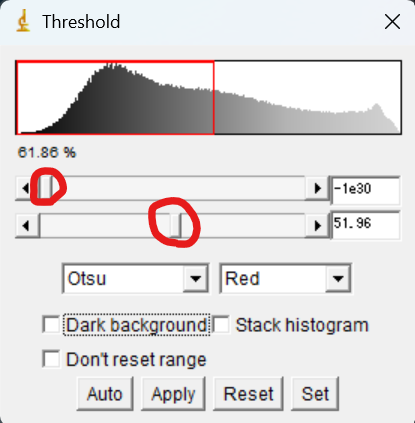
Then, click "Apply" to put threshold
"Apply"をクリックする- "Convert to Mask"

- Method: Selected algorithm
Backgroud: Light
☑ Calculate threshold for each image
(If you have set a manual threshold, uncheck it)
(もしマニュアルで閾値を設定していた場合はチェックを外す)
Then, click "OK"
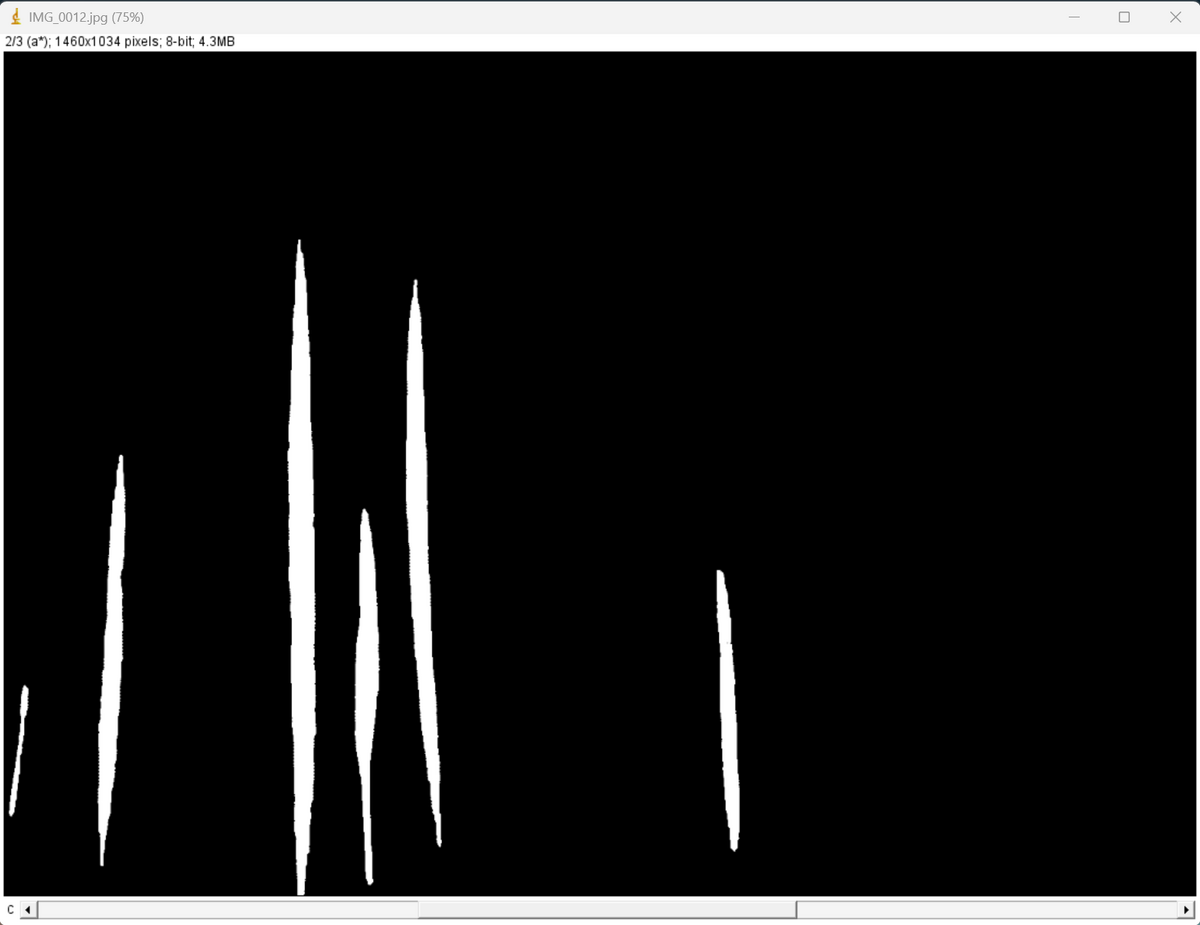
- You can get a binary image
here you can see extracted six leaves
このように、2値化された画像が出力される
この例では、6つの葉が抽出されます
- Image -> Type -> Lab Stack
Conduct Lab stack
- Analyze -> Set Measurements
Set parameters to be measured
計測するパラメータの設定- For more information, the following is helpful.
詳細は以下のサイトが参考になります。
imageJで測れるものは?Set Measurementsの設定 (life-science-project.com)
- For more information, the following is helpful.
- Analyze -> Analyze Particles
Perform measurements of each organ
各器官の計測の実施- Size: Minimum and maximum size of each part to be analyzed. By increasing the minimum size, small noise particles can be removed for analysis.
解析対象となる各器官の最小サイズと最大サイズです。最小サイズを大きくすることで、小さなノイズ粒子を取り除いて解析することができます。 - Put check in following four check boxes
Click "OK"
以下の4つのチェックボックスにチェックを入れてください。
"OK "をクリック
- Click "No"
"No "をクリック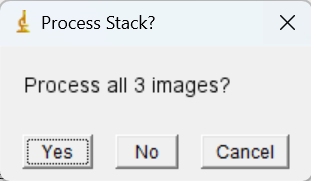
- Size: Minimum and maximum size of each part to be analyzed. By increasing the minimum size, small noise particles can be removed for analysis.
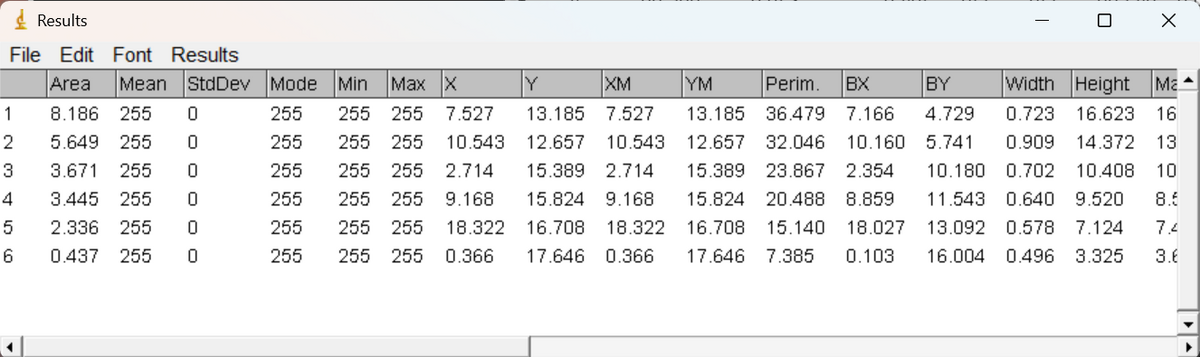
- You can get three windows
3つのウィンドウが開きます。- "Results"
Here, you can see the area, width, height, and so on for each leaf.
"Results"
ここでは、各葉の面積、幅、高さなどを確認することができます。
- "Summary"
Here, you can see the total area, average size and so on.
"Summary"
ここでは、総面積や平均サイズなどを確認することができます。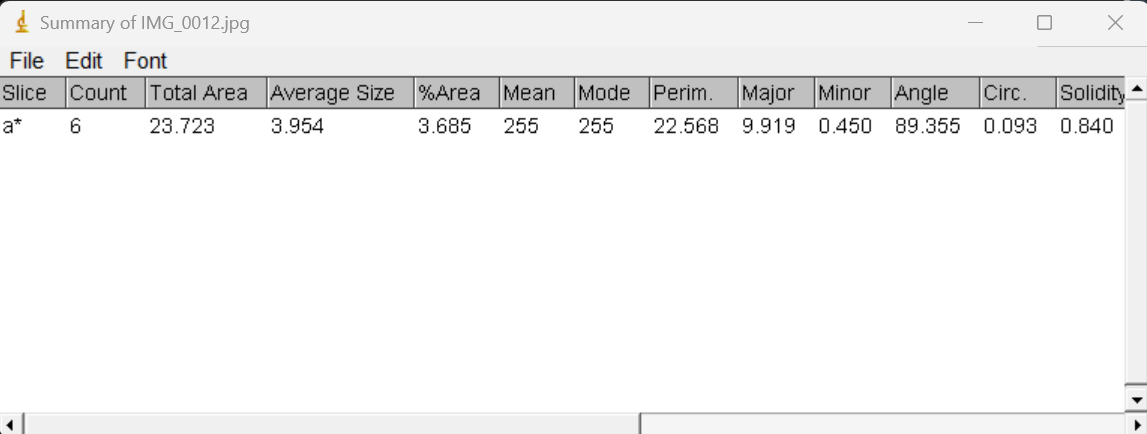
- File -> Save As
You can save these tables as csv file
これらのテーブルは、csvファイルとして保存することができます。 - "ROI Manager"
ROI is the information of region of each part
Select all the ROIs, then
ROI(region of interest)とは、各器官の各領域の情報です。すべてのROIを選択し、
More -> Save
You can save the ROI information as zip file
ROI情報をZIP形式で保存することができます
- "Results"
- File -> Open
- Calculation of the average pixel value for each part
各器官の平均画素値の算出- File -> Open
You can open the cropped image file which you saved
保存した切り抜き画像ファイルを開く - Perform set scale as before
- File -> Open
You can open the zip file of ROI which you saved
保存したROIのZIPファイルを開く - This time we will process the red channel of the RGB image.
今回はRGB画像の赤のチャンネルを処理してみます。 - Image -> Type -> RGB Stack
- Select a channel to process
This is an example of red channel
処理するチャンネルを選択する
これは赤色のチャンネルの例です
- Select all ROIs and click "Measure"
すべてのROIを選択し、"Measure "をクリック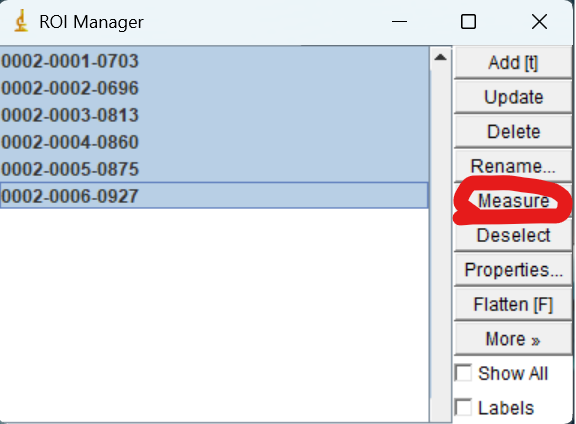
- You can get the results of the mean pixel value of red for each leaf
各器官の赤色の平均画素値の結果を取得することができます
- File -> Open
You can open the cropped image file which you saved
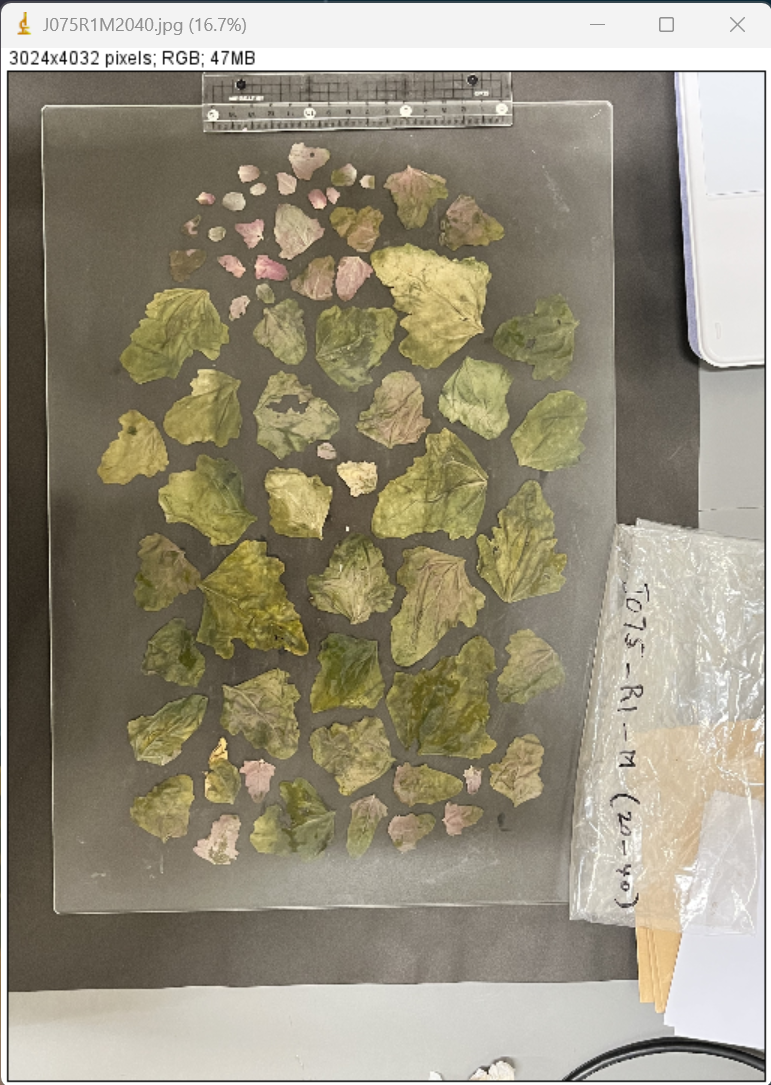
- It is a good idea to use acrylic plates like this one to keep the leaves open and fixed in less reflective conditions.
反射の少ない条件で葉を開いて固定した状態で撮影を行うため、このようなアクリル板を使用するのがよいでしょう。
【楽天市場】ノングレア アクリル板 A3サイズ(297mm×420mm)反射低減 透明 3mm厚 角丸 糸面取り 側面磨き 付き:看板ショップ (rakuten.co.jp)

Texture analysis of orthoimages created from UAV aerial images using QGIS(UAV空撮画像から作成したオルソ画像をQGISを用いてテクスチャ解析する)
- Overview 概要
- Check version compatibility バージョンの対応関係を確認
- Download QGIS
- Download OTB
- Introducing OTB into QGIS OTBをQGISに導入する
- Texture analysis using OTB OTBを用いてテクスチャ解析をする
- Multiple images can be analyzed at once in batch processingバッチ処理で複数の画像を一括で解析できる
Overview
概要
Texture analysis, which can quantify the texture of an image, is used to estimate crop growth from images, along with vegetation indices. Here, the Orfeo Toolbox (OTB) is implemented in QGIS, a free GIS software, to create texture orthoimages from orthoimages (RGB, multispectral) created from UAV aerial images.
画像の質感を数値化できるテクスチャ解析は,植生指数などとともに画像からの作物の生育推定に用いられています.ここでは,無料の地理情報システムソフトであるQGISにOrfeo Toolbox(OTB)を導入し,UAV空撮画像から作成したオルソ画像(RGB,マルチスペクトル)から様々なテクスチャ指標のオルソ画像を作成します.
Check version compatibility
バージョンの対応関係を確認
This is important for setups. First, check the correspondence between the version of QGIS and OTB that you will be using. According to this page, OTB 8.0.0 can be used with QGIS >= 3.18.
環境構築において非常に重要です.まず,今回使うQGISとOTBのバージョンの対応関係を確認しましょう.
こちらによると,OTB 8.0.0はQGIS >= 3.18で使用可能とのこと.
QGIS interface — Orfeo ToolBox 8.1.1 documentation (orfeo-toolbox.org)
The operation has been confirmed with QGIS = 3.22.5 and OTB = 8.0.0.
QGIS = 3.22.5, OTB = 8.0.0で動作確認済.
Download QGIS
QGIS is free software that allows users to browse and analyze geographic information systems. Because it is open source, development of useful plug-ins has been active, and OTB is one of such plug-ins used here. The latest version can be downloaded from the official QGIS website.
QGISとは,地理情報システムの閲覧や分析ができる無料のソフトウェアです.オープンソースであるため,便利なプラグインの開発が盛んにおこなわれており,今回用いるOTBもそうしたプラグインの1つです.
QGISの公式サイトから最新版がダウンロードできます.
However, in this case, we want to download the version we just checked, so let's download the appropriate version from this archive.
しかし,今回は先ほど確認したバージョンをダウンロードしたいので,こちらのアーカイブから該当するバージョンのものをダウンロードしましょう.
https://download.qgis.org/downloads/
The QGIS Documentation is available here.
ちなみに,QGISのDocumentation(説明書)はこちらにあります.
https://docs.qgis.org/3.22/ja/docs/index.html
Download OTB
OTB is an open source project for processing remote sensing images. This time, texture analysis is performed using OTB. Similarly, download the appropriate version of OTB from this archive.
OTBとは,リモートセンシング画像にさまざまな処理を施すためのオープンソースプロジェクトです.今回はこのOTBを使ってテクスチャ解析を行います.
同様に,OTBについてもこちらのアーカイブから該当するバージョンのものをダウンロードしましょう.
Index of /packages/archives/OTB (orfeo-toolbox.org)
Although not used in this project, the latest version can be downloaded from the official OTB website.
なお,OTBの公式サイトからは最新版がダウンロードできます.
Orfeo ToolBox – Orfeo ToolBox is not a black box (orfeo-toolbox.org)
Introducing OTB into QGIS
OTBをQGISに導入する
Place the downloaded OTB file in C:.
Open QGIS.
At the top, click on the
Plugins
→Manage and Install Plugins
→Settings
→Plugin Repositories
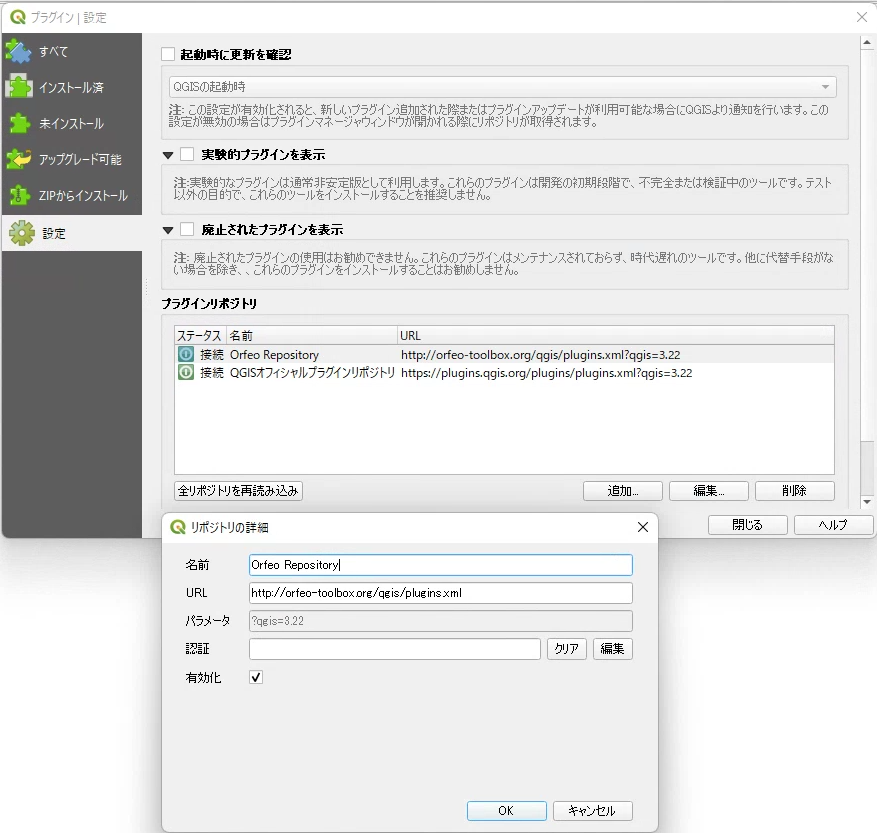
→Add
name it Orfeo Repository,
set URL to http://orfeo-toolbox.org/qgis/plugins.xml,
check the "Enabled" checkbox,
and OK.
ダウンロードしたOTBのファイルはC: に配置しておきましょう.
QGISを開きます.
上のほうにある
プラグイン
→プラグインの管理とインストール
→設定
→プラグインリポジトリ
→追加
で名前をOrfeo Repository
URLをhttp://orfeo-toolbox.org/qgis/plugins.xmlとし,
有効化にチェックを入れてOK
Plugins
→Manage and Install Plugins
→All
→check "Orfeo Toolbox provider" checkbox
プラグイン
→プラグインの管理とインストール
→すべて
→Orfeo Toolbox providerにチェック
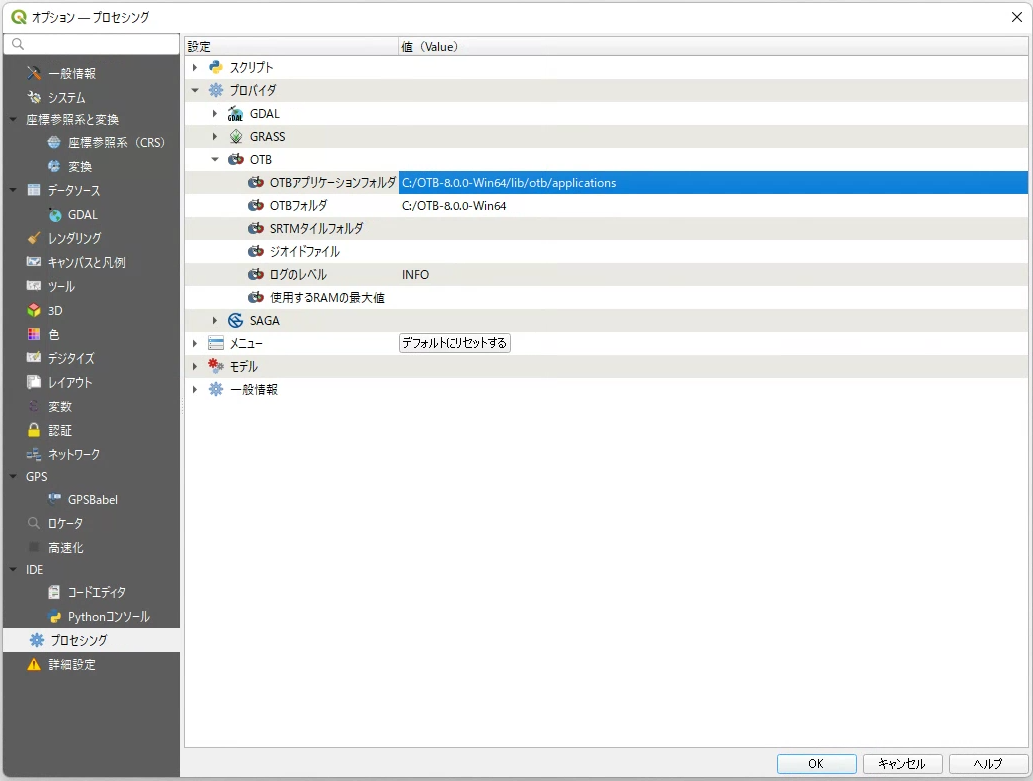
Settings
→Options
→Processing
→Providers
→OTB
OTB application folder: C:/OTB-8.0.0-Win64/lib/otb/applications
OTB folder: C:/OTB-8.0.0-Win64
check the "Enabled" checkbox, and OK.
設定
→オプション
→プロセシング
→プロバイダ
→OTB
でOTBアプリケーションフォルダをC:/OTB-8.0.0-Win64/lib/otb/applications
OTBフォルダをC:/OTB-8.0.0-Win64とし,
有効化にチェックを入れてOK

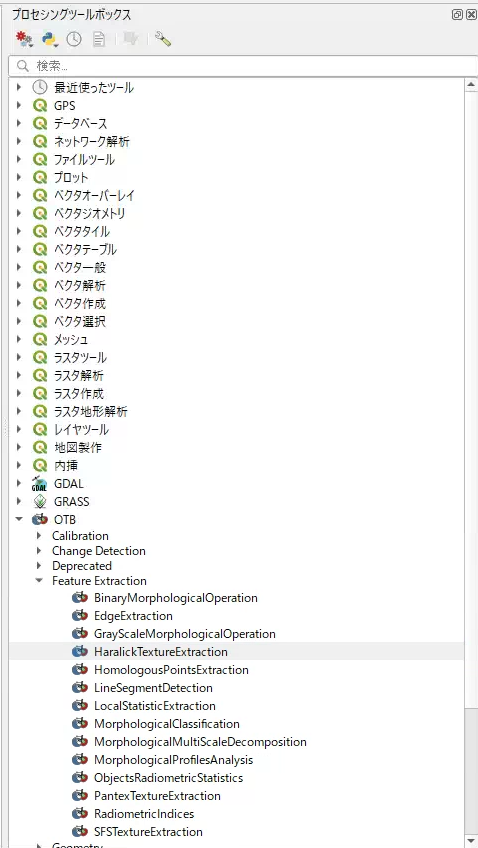
Thereafter,
Processing
→ Toolbox
to check the processing toolbox, you can see OTB is available.
その後,
プロセシング
→ツールボックス
でプロセシングツールボックスを確認すると、OTBが使えるようになっている
Texture analysis using OTB
OTBを用いてテクスチャ解析をする
You can conduct texture analysis from Processing
→ Toolbox
→ OTB
→ Feature Extraction
→ HaralickTextureExtraction
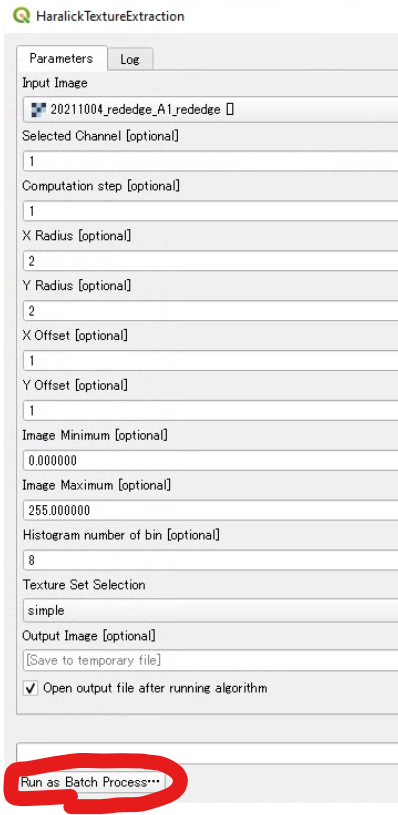
parameters as below:
- Input Image: Source image for texture analysis
- Selected Channel: Allows you to select a channel of the source image to process.
- X Radius, Y Radius: size of the kernel, where X is the width and Y is the height. 2 × radius + 1 is the actual size of the kernel.
- Offset: Distance between pixels used to compute the texture.
- Histogram number of bin: Number of dimensions after dimensionality compression.
- Texture Set Selection: type of output texture images
プロセシング
→ ツールボックス
→ OTB
→ Feature Extraction
→ HaralickTextureExtraction
からテクスチャ解析ができます。
パラメータは以下の通り
- Input Image:テクスチャ解析の元となる画像
- Selected Channel:処理を行う元画像のチャンネルを選ぶことができる
- X Radius, Y Radius:カーネルのサイズ.Xが横でYが縦.2 × radius + 1がカーネルのサイズになる.
- Offset:テクスチャの計算に使われる画素間の距離
- Histogram number of bin:次元圧縮後の次元数
- Texture Set Selection:出力されるテクスチャ画像の種類
Multiple images can be analyzed at once in batch processing
バッチ処理で複数の画像を一括で解析できる
Some software and tools have a batch processing function that performs multiple processes on multiple inputs at once.
The OTB we are using here also has a batch processing function, which can be used for efficient texture analysis.
Click on Run as Batch Process...
ソフトウェアやツールには、バッチ処理という複数の入力に対して複数の処理を一括で行ってくれる機能がついてたりします。
今回扱っているorfeo toolboxにもバッチ処理の機能が付いており、これを活用することで効率的にテクスチャ解析が可能です。
以下のRun as Batch Process...から
You can move to the following window.
以下のようなウィンドウに推移できます。

Here, by clicking the + icon in the upper left corner to add a row, and setting the parameters as described before, the analysis of the set contents will be performed at once.
ここで、左上の+アイコンをクリックして行を追加し、先ほどのパラメータを設定していくことで、設定した内容の解析を一括で行ってくれます。
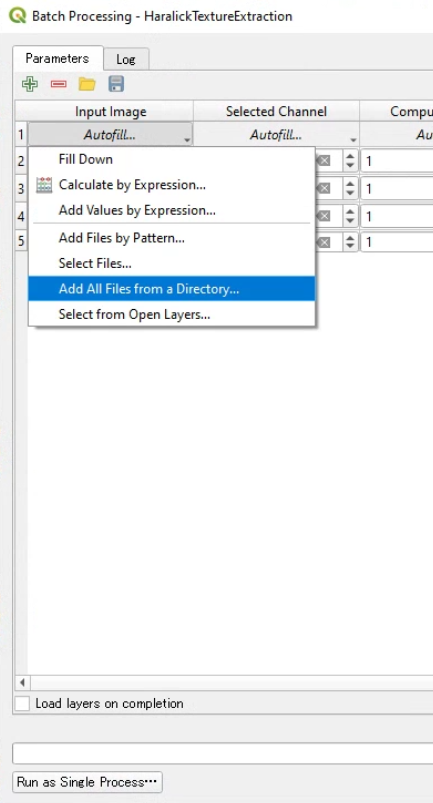
It has an Autofill function, which automatically adds a line for the same item, and when a Directory is selected, all file names contained in it can be automatically entered.
Autofill機能が備わっており、自動で同項目の行を追加したり、Directoryを指定するとそこに含まれるすべてのファイル名が自動で入力できたりします。
In addition, it is convenient later on to save the settings with the floppy disk icon in the upper left corner and to load them with the folder icon, in case of processing.
また、左上のフロッピーディスクのアイコンで設定した内容の保存、フォルダのアイコンからロードができるので、処理を行った場合には、一応保存をしておくと後々便利です。
How to clip images from a video at regular intervals automatically(動画から一定間隔で画像を自動で切り取る方法)
Reconstructing a 3D model using aerial drone images requires taking images with a certain degree of overlap (80-90%) between neighboring images.
Automatic flight applications that collect images with a set overlap ratio are useful, but sometimes that overlap ratio is not sufficient and the 3D reconstruction does not work.
If a video, a continuous sequence of images, is captured, it is possible to flexibly extract the images from the video.
As a pre-processing step for 3D model development, free software "VLC media player" or "VideoProc Converter" or a website for converting the movie to images can be used to automatically clip images from videos.
I recommend using "VLC media player", which allows you to specify the image to be cropped by the number of frames instead of the number of seconds.
Here is how it is done.
ドローンの空撮画像を用いて3Dモデルを再構築するには、ある程度以上の隣接する画像の重なりを保ったまま(80-90%が必要とされます)で画像を撮影する必要があります。
設定した重なり率で画像を収集する自動飛行アプリケーションは便利ですが、その重なり率が十分でないと、3D再構成がうまくいかないことがあります。
連続した画像からなる動画を撮影しておけば、動画から柔軟に画像を抽出することが可能です。
3Dモデル開発の前処理として、フリーソフトVLC media playerやVideoProc Converter、a website for converting the movie to imagesを利用して動画から画像を自動的に切り出すことができます。
VLC media player "を使うと、切り取る画像を秒数ではなくフレーム数で指定することができるので、おすすめです。
以下はその方法を紹介します。
A website for converting the movie to images
動画から画像を切り出せるウェブサイト
以下のサイトの指示に従って行ってください。
You can follow the instruction on the following website.
VLC media player
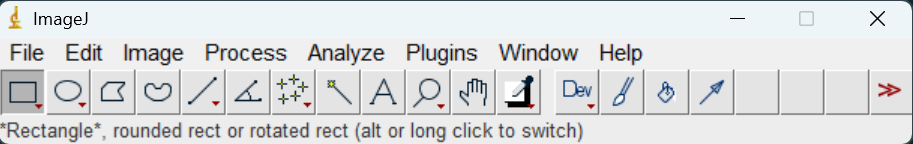
- Tools->Preferences

- click "All"

- click ">" next to "Filters" in "Video"

- click "Scene filter"

Here, you can select;
the image format: jpg or png.
Image width and Image height: -1 means the same size as the original file.
Filename prefix: the name of the common part of the output images. The output file name will be the value specified here, followed by a 5-digit frame number (starting from "00001″).
Directory path prefix: the name of the directory of the folder where the output images are saved. A folder must be created in advance.
Always write to the same file: Unchecked.
Recording ratio: Specify how many frames to capture an image. For example, for a video recorded at 30 FPS (frames per second), if 15 is specified here, two images will be captured every second. You can check the FPS of a video from its properties -> "details".
ここで、以下の項目を選択することができます。
画像形式:jpgまたはpng
画像の幅と高さ: -1はオリジナルファイルと同じサイズを意味します。
ファイル名プレフィックス:出力画像の共通部分の名前です。出力ファイル名は、ここで指定した値の後に、5桁のフレーム番号("00001″から始まる)を付けたものになります。
ディレクトリパスのプレフィックス:出力画像を保存するフォルダのディレクトリ名です。あらかじめフォルダーを作成しておく必要があります。
常に同じファイルに書き込む: チェックをはずす。
記録比率: 何フレームで画像を取り込むかを指定します。例えば、30FPS(frames per second)で記録された動画の場合、ここで15を指定すると、1秒間に2枚の画像をキャプチャすることになります。動画のFPSは、動画のプロパティ→「詳細」から確認することができます。

After setting up, click "Save".
- Tools->Preferences
- click "All"
- Move to "Filters" and check "Scene video filter"
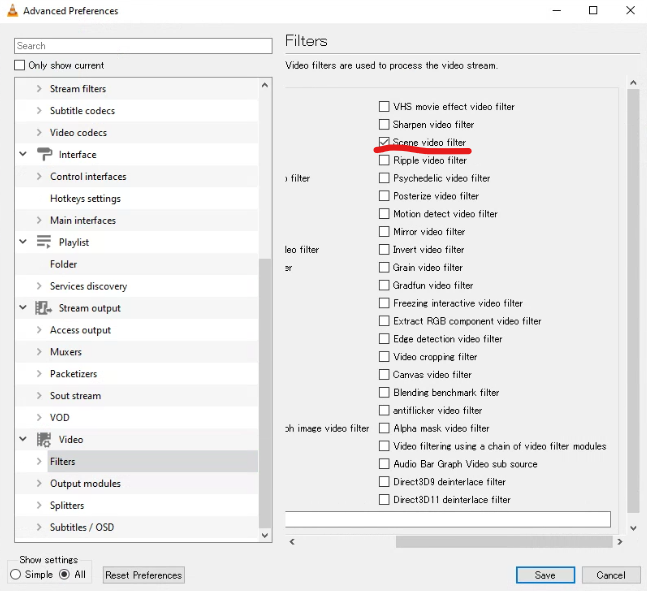
After setting up, click "Save".
- Close "VLC media player" and open it again.
- Drug and release a video file on the software to run the process.
VideoProc Converter
【公式】VideoProc Converter - かなり使える多機能動画処理ソフト|動画変換・録画ならVideoProc Converterにお任せ!
Select "ビデオ"

Select "ビデオ" to open a video for processing
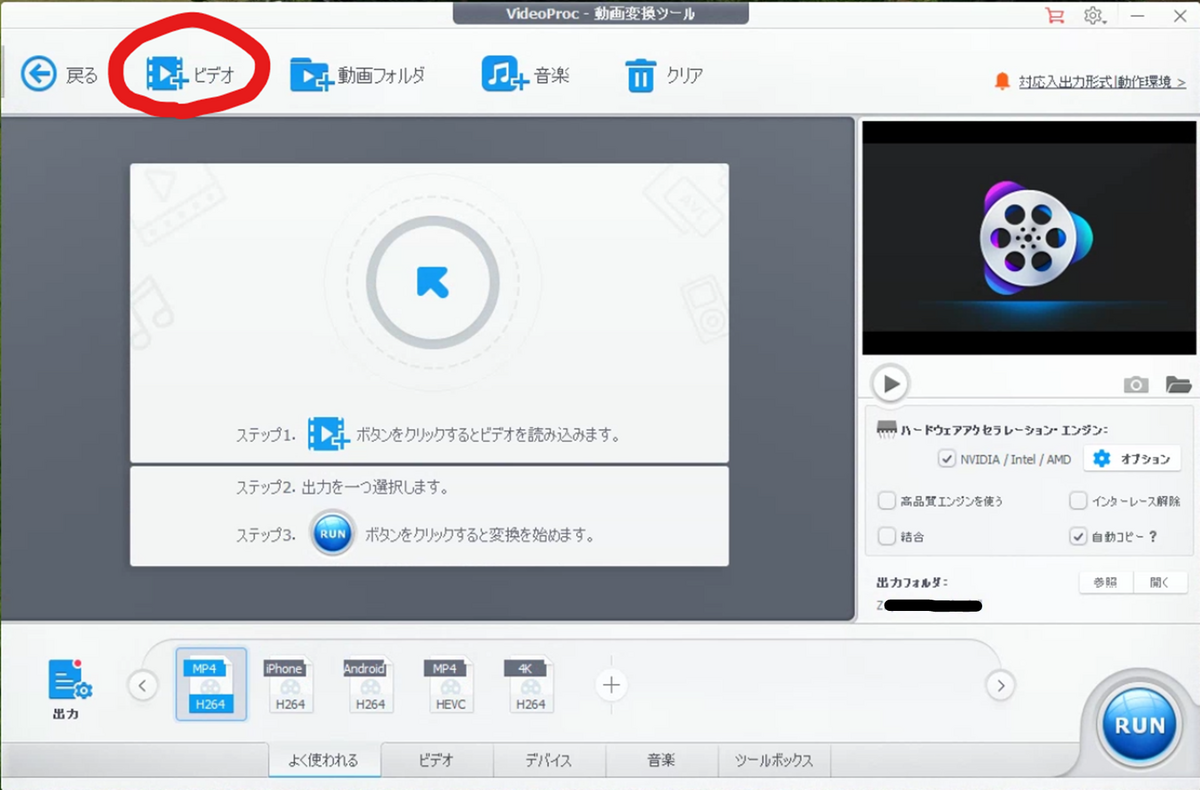
Select a video and click "open"

move to "ツールボックス" and select "スナップショット"
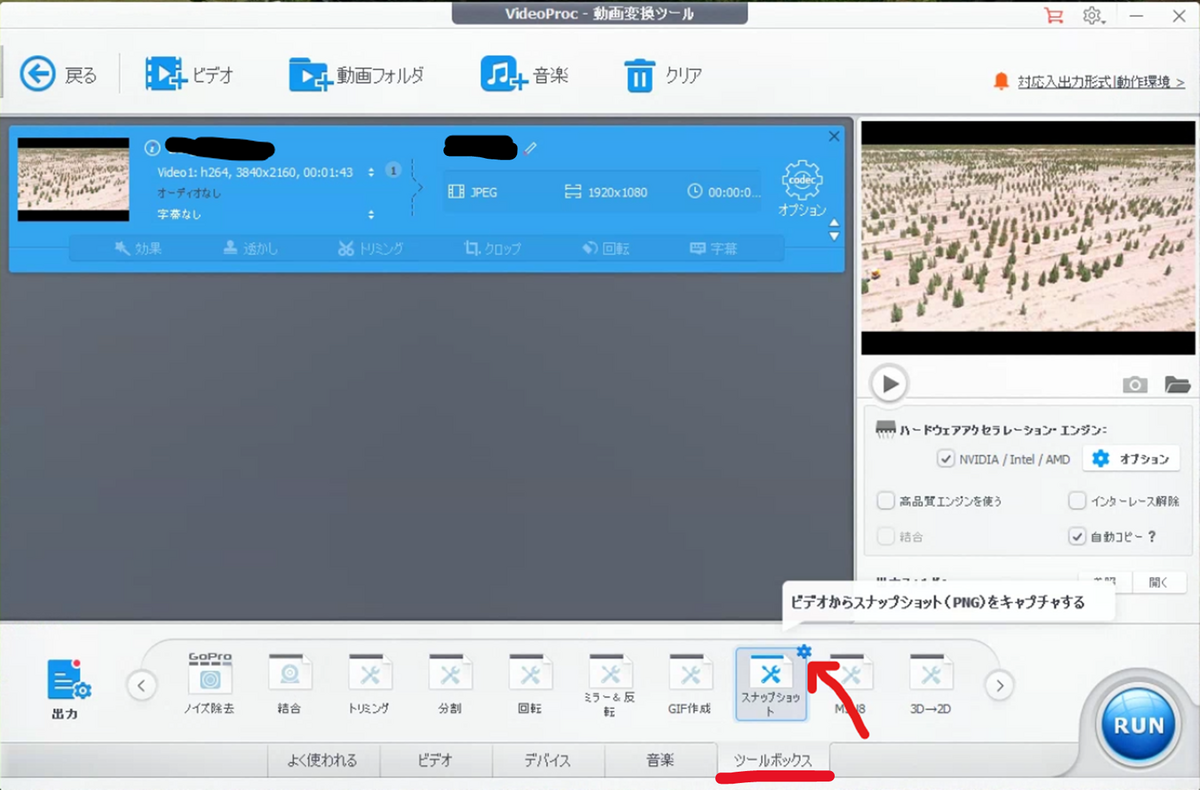
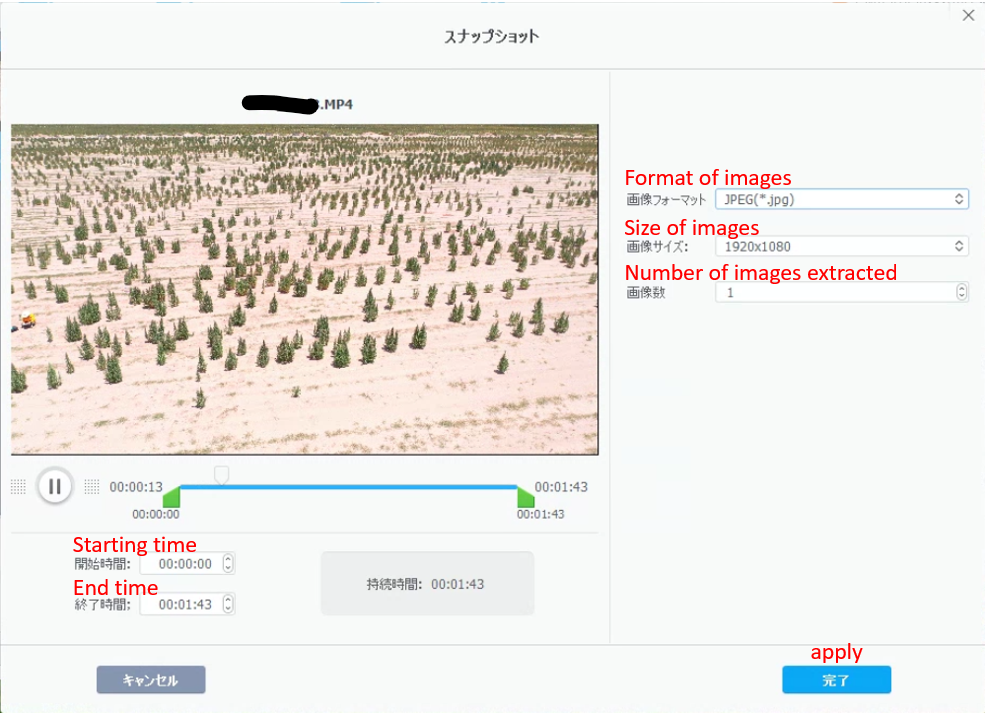
You can change the options for image extraction from "オプション" here

In most cases, Size of images can be set to "元と同じ" meaning the same as the original.
The number of images to be extracted should be set as required to develop the 3D model.
click "参照" to change the folder for extracted images.
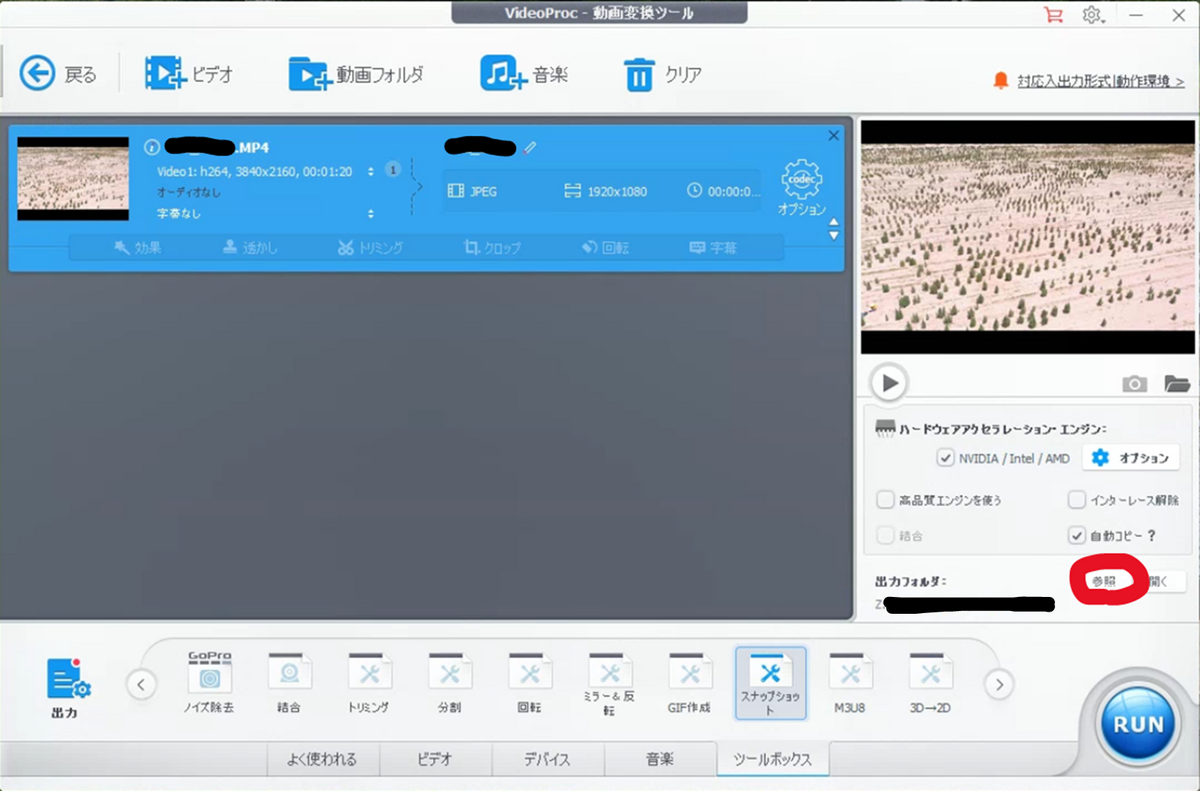
click "RUN"

click "次へ"
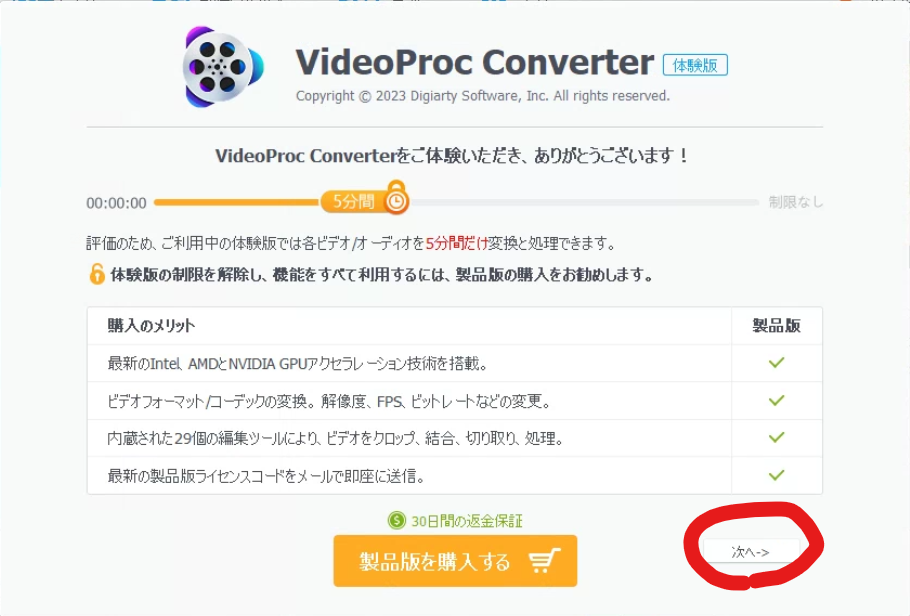
The following screen will be displayed until the conversion starts and finishes.
- Do not check the upper checkbox. If checked, the PC will shut down after processing.

- Do not check the upper checkbox. If checked, the PC will shut down after processing.
Then the extracted images are stored in the folder named the same as the original video in the selected folder.
For EfficientNet implementation in neural network console
The paper proposed EfficientNet didn't aim to develop a specific network architecture but a method to scale up a certain model with taking a balance among width, depth, and resolution. However, the model architecture proposed by the authors was quite efficient and utilized in various research. This is a memo to implement EfficientNet in neural network console, a free software for deep learning produced by SONY.
- EfficientNet
- They found a optimal way to scale up the model
- Width (the number of output channels)
- Depth (the number of layers)
- Resolution (the size of input images)

[1905.11946] EfficientNet: Rethinking Model Scaling for Convolutional Neural Networks (arxiv.org)
- Baseline network architecture of the EfficientNet

[1905.11946] EfficientNet: Rethinking Model Scaling for Convolutional Neural Networks (arxiv.org)
- Scaling method
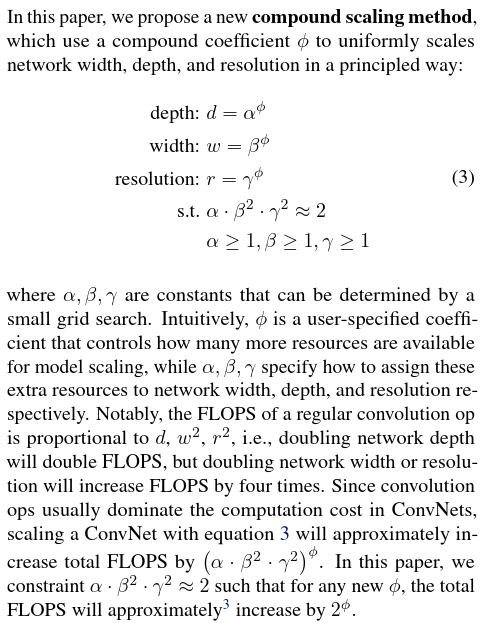
The actual coefficients used in this paper are as follows;[1905.11946] EfficientNet: Rethinking Model Scaling for Convolutional Neural Networks (arxiv.org)
params_dict = {
(width_coefficient, depth_coefficient, resolution, dropout_rate)
'efficientnet-b0': (1.0, 1.0, 224, 0.2),
'efficientnet-b1': (1.0, 1.1, 240, 0.2),
'efficientnet-b2': (1.1, 1.2, 260, 0.3),
'efficientnet-b3': (1.2, 1.4, 300, 0.3),
'efficientnet-b4': (1.4, 1.8, 380, 0.4),
'efficientnet-b5': (1.6, 2.2, 456, 0.4),
'efficientnet-b6': (1.8, 2.6, 528, 0.5),
'efficientnet-b7': (2.0, 3.1, 600, 0.5),
'efficientnet-b8': (2.2, 3.6, 672, 0.5),
'efficientnet-l2': (4.3, 5.3, 800, 0.5),
}tpu/efficientnet_builder.py at master · tensorflow/tpu · GitHub
Substituting into the original equation from here, we get;
α = 1.2, β = 1.1, γ = 1.15,
φ = 0, 0.49, 1.07, 2.09, 3.78, 5.09, 6.14, 7.05 for b0-b7 - MBConv?
- A
MBConvis a Inverted Linear BottleNeck layer with Depth-Wise Separable Convolution.
- MBConv module structure
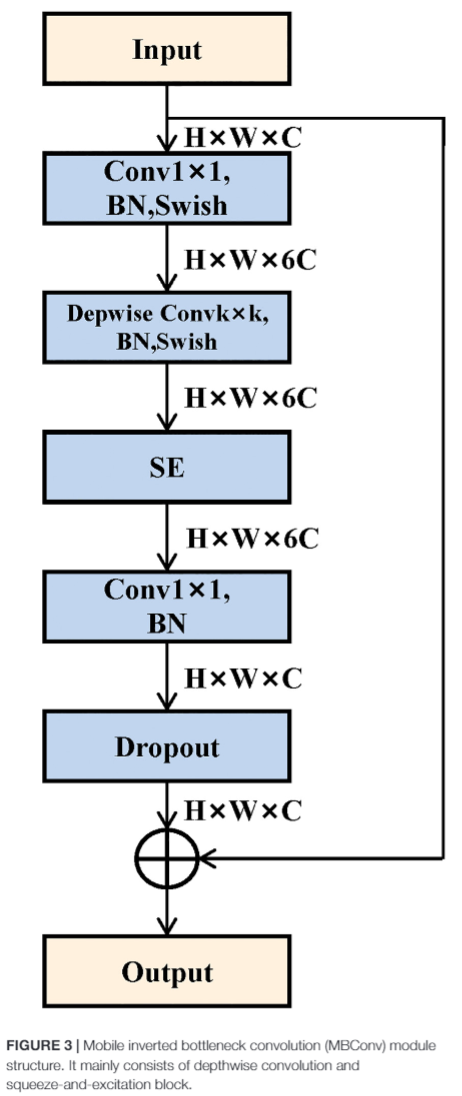
BN: batch normalization
SE: squeeze-and-excitation block
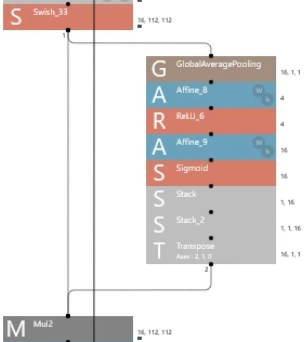
- Swish?
- A kind of activation function that has several advantages over ReLU, a common activation function for CNN.
- The choice of activation functions in deep networks has a significant effect on the training dynamics and task performance. Currently, the most successful and widely-used activation function is the Rectified Linear Unit (ReLU). Although various alternatives to ReLU have been proposed, none have managed to replace
it due to inconsistent gains. In this work, we propose a new activation function, named Swish, which is simply f(x) = x sigmoid(x).

[1710.05941v1] Swish: a Self-Gated Activation Function (arxiv.org)
- Three advantages introduced in the paper
- Avoid saturation saturation can be avoided compared to the function which is unbounded above such as tanh.
- Strong regularization effect Large negative values are output as zeros, the so-called forgetting effect, which results in a high regularization effect.
- Smoothness for model optimization and generalization
The output landscape of the Swish network is smoother, affecting the smoothness of the loss landscape and facilitating optimization.

[1710.05941v1] Swish: a Self-Gated Activation Function (arxiv.org)
- Batch normalization?
- A layer performing the normalization for each training mini-batch.
- Batch Normalization improves learning speed, suppresses overlearning, and suppresses initial value dependence.
- Batch normalization effectively increased learning efficiency.

- squeeze-and-excitation block?
- Block to weight each channel of the convolution layer

- Block to weight each channel of the convolution layer
- Depthwise convolution and pointwise convolution?
- Convolution in the channel direction and in the image direction is done at the same time in the usual convolution, but by doing them separately, the computational cost can be greatly reduced.

- Convolution in the channel direction and in the image direction is done at the same time in the usual convolution, but by doing them separately, the computational cost can be greatly reduced.
- A
- They found a optimal way to scale up the model
- Other difficulties
- The smallest integer that exceeds the value calculated by multiplying the number of layers in each stage of the baseline by the depth_coefficient, where is the number of layers in each stage.
- EfficientNet-b7

- EfficientNet-b4


- EfficientNet-b7
- width (number of channels) of each block in each stage

https://towardsdatascience.com/complete-architectural-details-of-all-efficientnet-models-5fd5b736142
- stack and transpose are needed to make squeeze-and-excitation block
- The smallest integer that exceeds the value calculated by multiplying the number of layers in each stage of the baseline by the depth_coefficient, where is the number of layers in each stage.
- References
- 2019年最強の画像認識モデルEfficientNet解説 - Qiita
- EfficientNetの各モデルの係数について - Qiita
- [活性化関数]Swish関数(スウィッシュ関数)とは?:AI・機械学習の用語辞典 - @IT (itmedia.co.jp)
- Batch Normalization:ニューラルネットワークの学習を加速させる汎用的で強力な手法 - DeepAge
- 論文メモ: Squeeze-and-Excitation Networks - Qiita
- Deep Learning精度向上テクニック:様々なCNN #1 - YouTube
- Deep Learning精度向上テクニック:様々なCNN #2 - YouTube
- Depthwise Separable Convolutionについて分かりやすく解説! | AGIRobots
- MobileNet(v1,v2,v3)を簡単に解説してみた - Qiita
Why did I start this blog? and what kind of blog is it going to be?(なんではじめたのか?とどういうブログになりそうか?の話)
Hi, I'm Guchyos.
I am a PhD student in the field of agriculture.
I am usually working on estimating the growth of rice plants from images taken by a drone.
どうも,Guchyosです.
農学系の博士課程に在籍中です.
普段はドローンで撮影した画像からイネの生育を推定する研究をしています.
The content of this article is as the title says.
今回書く内容は,標記の通りです.
Recently, the development of AI technology has been remarkable, and many applications and extensions that make use of such technology have been created. In this context, recently, I have been personally trying out various useful tools in the world. In the process, I found Logseq, a task management and memo application. I had been managing my daily work diary in onenote, but I had to move tabs every time I wanted to look back on it, and I felt it was a little inconvenient to use because it was not easy to link information together. In Logseq, a page for daily work diary is automatically generated, and if you put a tag on it and write down what you did, you can just go to the page of the tag and see what you have done each day in order. I personally found this to be a very useful feature. There are many other interesting extensions, so if you are interested, please try it.
最近,AI技術の発展が著しく,そうした技術を活用したアプリや拡張機能などが乱立しています.そうした折,一度世の中の便利なツールをいろいろ試してみようの企画を個人的にやっていました.その中でLogseq(ログシーク)というタスク管理,メモアプリ見つけました.今までonenoteで日ごとに作業日誌を管理していたりしたのですが,見返すときにいちいちタブを移動しなければならなかったり,情報同士の紐づけに弱く若干の使いづらさを感じていました.Logseqでは,作業日誌が毎日自動的に立ち,タグをつけてそこにそのままやったことをメモしていけば,そのタグのページに遷移するだけで日ごとにやってきたことが順に並ぶようになってます.そこが個人的にかなり有難いポイントでした.ほかにも拡張機能がいろいろあっておもしろいので,興味があったらぜひ使ってみてください.
That's why I started using Logseq, which is basically written in Markdown format. It is convenient because it can be used in conjunction with Zotero, a free bibliography management software, to keep a record of the papers I have read. I remembered that Markdown is used to describe web pages in a neat and concise manner, and I thought it would be a good idea to upload my notes made with Logseq as a Blog, as I often need to share knowledge in the lab. I thought that if I uploaded my notes as a Blog, anyone could access it easily, it would be easier to read, and I would be able to read and write in a way that would deepen my own understanding. I remembered that Markdown is used to describe web pages in a neat and concise manner, and I found it useful to upload my notes made with Logseq as a Blog, as I often need to share my knowledge in the lab. I thought that if I uploaded my notes as a Blog, anyone could access it easily, it would be easier to read, and I would be able to read and write in a way that would deepen my own understanding.
そんなこんなで使い始めたLogseqですが,基本的にMarkdown形式で記述がされるようになっています.論文を読んだ記録とかも,フリーの文献管理ソフトZoteroと連携してできるので非常に便利で,同様にメモを貯めていっていました.そうしているうちに,Markdownてそういえば,Webページとかをきれいに簡潔に記述するためのものだよなということを思い出しました.Slackで有志で論文を紹介しあう場があったり,しばしばラボ内で知識を共有する必要性があったりする中で,Logseqで作成したメモをBlogとしてアップしておけば誰でもすぐアクセスできるし,より見やすくなるし,自分の理解もより深まるような読み方や書き方をするようになるのではないかと考えました.
Accordingly, this blog will mostly be a place to write about what I have learned from reading papers, to explain various methods of analysis, and to share other thoughts and things I have learned that are worth sharing.
ということで,本ブログは,たいがい論文を読んで学んだことを書いたり,様々な解析方法を解説したり,その他考えたことや知ったことで共有するに足るものを共有する場になると思います.
I hope this blog will be of some help.
よろしくお願いします.