The vegetation index is an indicator used to quantify the vigor of vegetation and has been used for monitoring vegetation using remote sensing. This index can be used to extract green leaves from an image. For example, there is a vegetation index called Excess Green (ExG), which is the sum of the difference between green and blue and green and red. Because chlorophyll does not reflect green light as well as blue and red light, ExG values are higher in areas of healthy green leaves. In this article, this ExG is used to set the threshold value to extract the green leaf area.
On the other hand, plant leaves may contain red regions in addition to green. For example, quinoa may accumulate a red pigment called betalain in its leaves. We may want to measure this area as well. In this article, we will use the a axis of the Lab color space to extract the red area.
植生指数は、植生の活性を定量化するための指標であり、リモートセンシングを用いた植生のモニタリングなどに用いられてきました。この指数を、画像から緑葉を抽出するのに使うことができます。例えば、緑と青の差と緑と赤の差を足し合わせたExcess Green(ExG)という植生指数があります。クロロフィルは、青色光と赤色光に比べて緑色光は反射しないという性質を持つため、健康な緑葉の領域ではExGの値が大きくなります。今回は、このExGを用いて閾値を設定することで、緑葉の領域を抽出します。
一方で、植物の葉には、緑の他に赤の領域が含まれることがあります。例えば、キノアは葉にベタレインという赤色の色素を蓄積することがあります。この面積も測りたくなったりします。今回、赤色の領域の抽出には、Lab色空間のa軸を用いてみます。
Green leaf area measurement
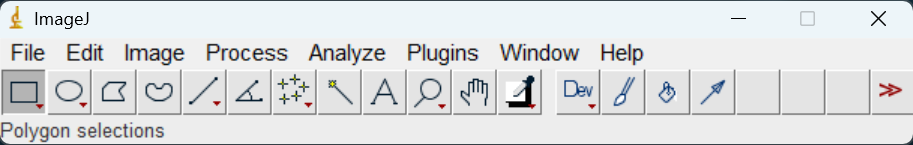
Setting of scale
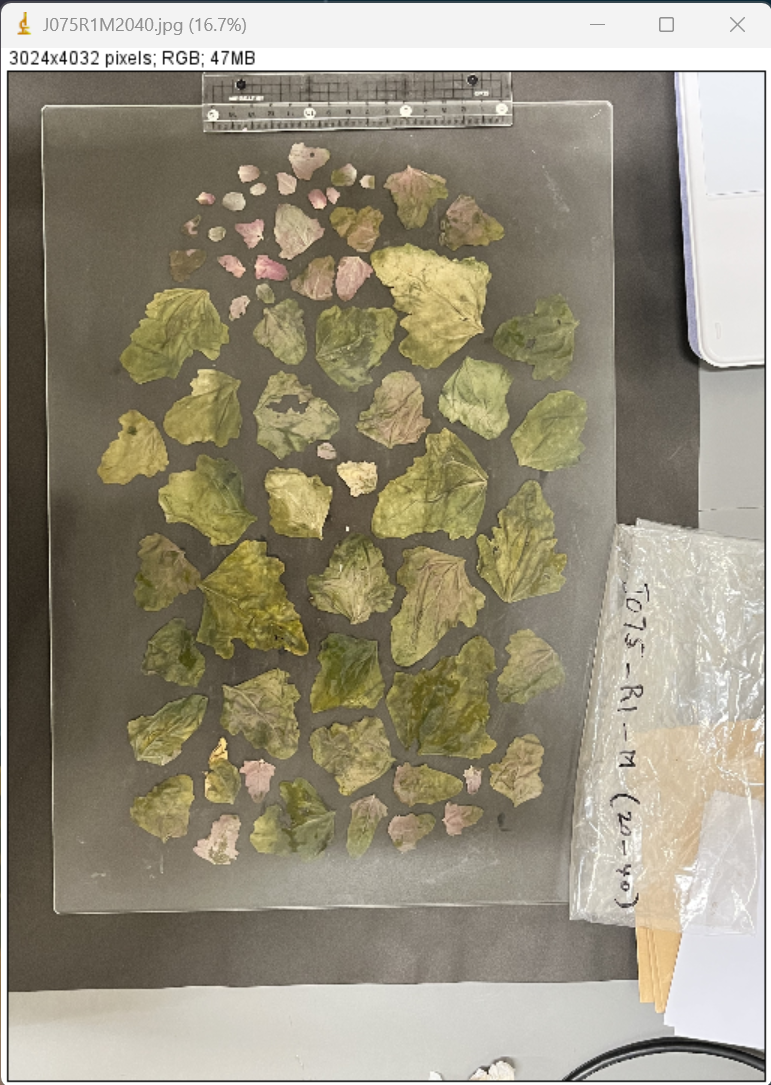
- File -> Open
- Make line to set scale
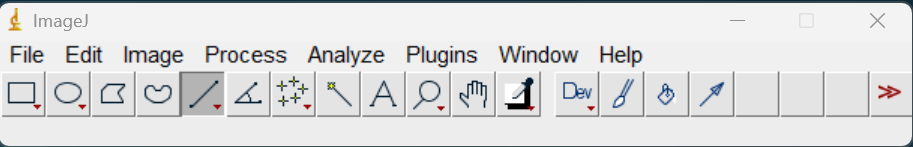
- Analyze -> Set scale
- Known distance: 10
- Unit of length: cm
Creating ExG Images
- right click on the original image and duplicate
- Image -> Type -> RGB stack
- Image -> Stacks -> Stack to Images Red, Green, and Blue channel image is opened
- Get Green - Red image
Process -> Image calculator
Image1: Green
Operation: Subtract
Image2: Red
check "Create new window" check box
"Result of Green" is opened
right click and rename the image "G-R" - Get Green - Blue image
Process -> Image calculator
Image1: Green
Operation: Subtract
Image2: Blue
check "Create new window" check box
"Result of Green" is opened
right click and rename the image "G-B" - Get ExG (Green-Red)+(Green-Blue) image
Process -> Image calculator
Image1: G-R
Operation: Add
Image2: G-B
check "Create new window" check box
"Result of G-R" is opened
right click and rename the image "ExG"
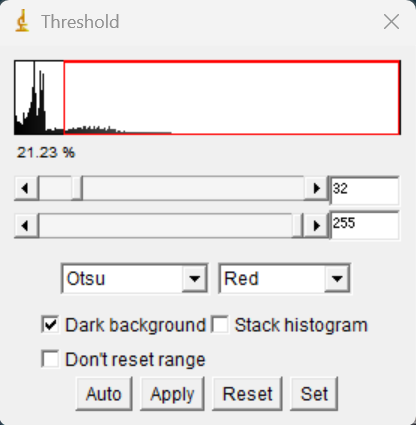
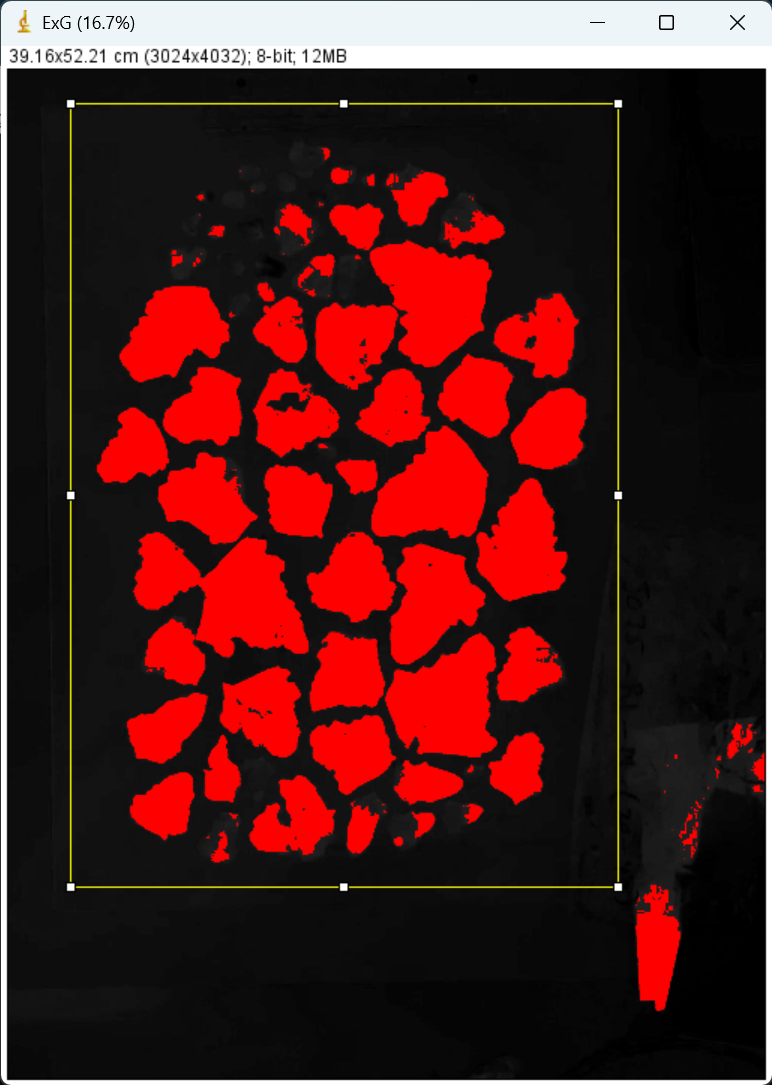
Extracting green leaf region and area measurement
- Image -> Adjust -> Threshold
Otsu
Red
check "Dark background" check box
- Select the region for calculation
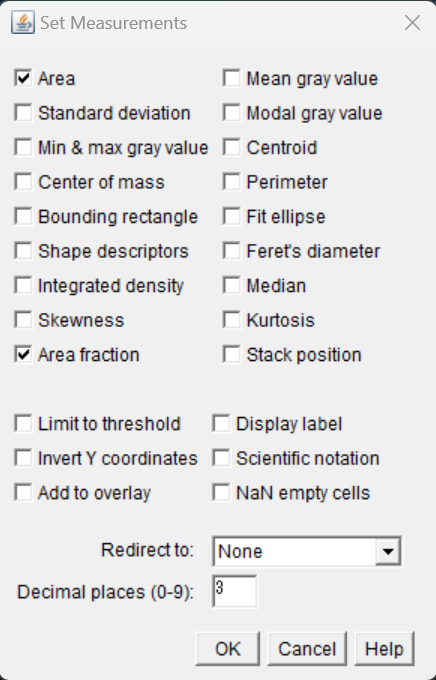
- Analyze -> Set measurements
check "Area" and "Area fraction" check box
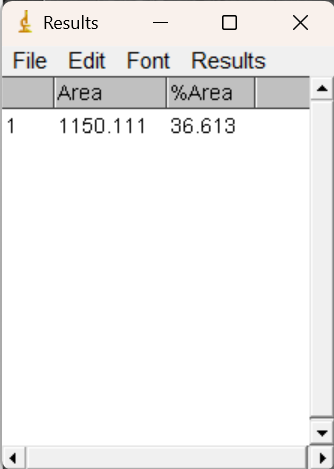
- Analyze -> measure
- "Results" window is opened
Area of the selected region and the area fraction of the thresholded region are output
by multiplying these values, area of the thresholded region is calculated
Red leaf area measurement
- right click on the original image and duplicate
- Image -> Type -> Lab stack
- Image -> Stacks -> Stack to Images
L, a, and b channel image is opened
a channel is used - Image -> Adjust -> Threshold
the threshold can be set manually by moving these bars
 Red
Red
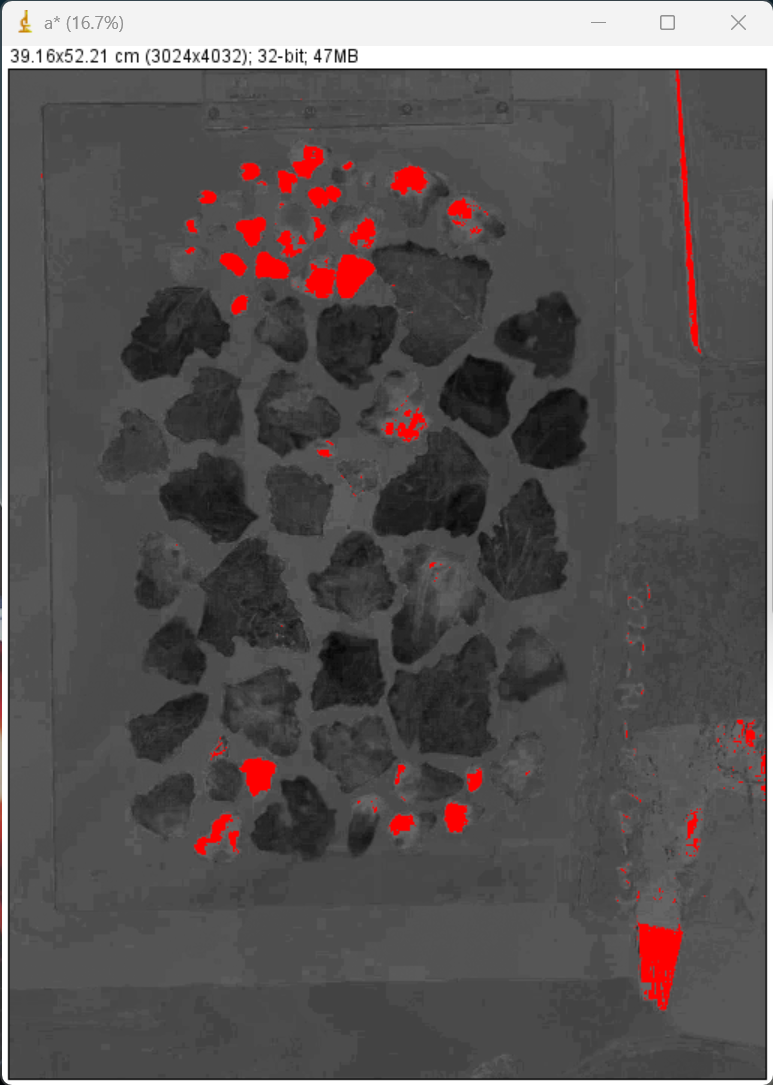
click "Set" button to fix the threshold - Analyze -> measure the results added in "Results" window as well